
In this article you’ll learn about the gold backing to debt ratio. Along with what the gold price would need to be at today to match two previous periods of debt reset…
Table of Contents
- Gold Backing to US Debt Ratio “Reset” in 1934
- Gold Backing to US Debt Ratio “Reset” in 1980
- Gold Backing to US Debt Ratio “Reset” in 2018
- What Price Would Gold Need to Be Today to Match the 26% Gold Backing to Debt Ratio in 1934 and 1980?
- Conclusion
- Video: A Reset Like in 1934 and 1980 Would Mean $21,000 Gold
Estimated reading time: 8 minutes
How do you determine gold’s value? Or put another way what price should gold be at? In our view this is the wrong way round and the question should be how many ounces of gold should a given currency be valued at?
However, in the world we live in, it is more common to think of a dollar price of gold, rather than a weight in ounces of gold for the dollar.
An excellent video, care of Youtube channel maneco64, looks at valuing gold in terms of US debt. He looks back to the previous two episodes where there was a currency “reset”. First in 1934 and then 1980.
In 1934 the gold price was reset by US President Roosevelt in the Gold Reserve Act. From $20.67 per troy ounce to $35.
While in 1980 there was a reset by the market where the gold price was pushed all the way up to $887.50.
He then arrives at a gold backing to debt ratio for each of those two periods.
He uses the US national debt during these times. Then he takes the US gold reserves and the current gold price to give a total value of gold reserves. Finally, the gold reserves are divided into the total debt to give a gold backing to debt ratio.
The formula is therefore: US Debt / (US Gold Reserves x Gold Price).
Gold Backing to US Debt Ratio “Reset” in 1934
So what was the gold backing to US debt in 1934?
US Gold reserves in 1934 were 202.5 million ounces.
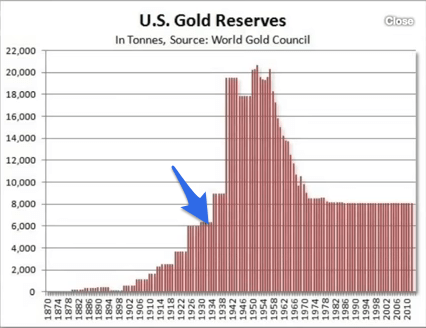
Via maneco64
Related: Australia has 80 Tonnes of Gold, How Much Gold Does New Zealand Have?
While US national debt was at $27 billion in 1934.
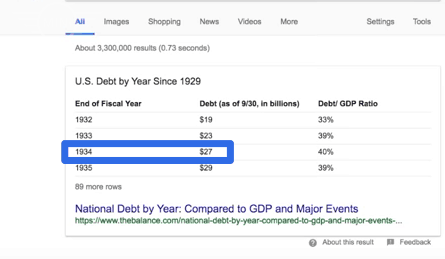
Via maneco64
The price of gold in 1934 had just been reset to $35 per ounce. So this came to $7 billion worth of gold (202.5 million ounces x $35 = $7 billion).
Therefore in 1934 the value of the total value of the US gold was 26% of the national debt ($7 billion / $27 billion).
Gold Backing to US Debt Ratio “Reset” in 1980
Now, what was the percentage gold backing to US debt in 1980?
US National debt in 1980 was $877 billion.
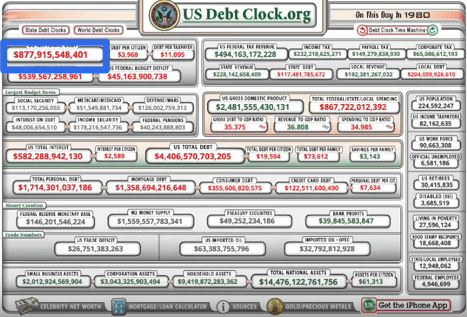
Via maneco64
While the price of gold spiked to $887.50 per ounce.
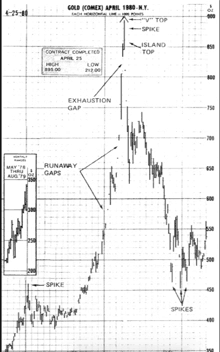
Via maneco64
US gold reserves were pretty similar to today at 261.5 million ounces.
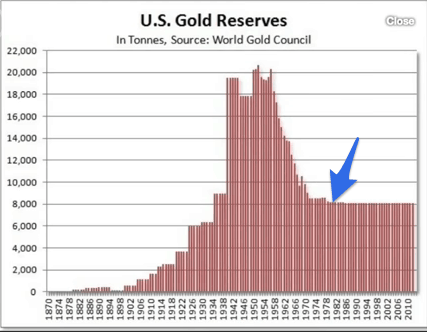
Via maneco64
Here’s the calculation: 261.5 million ounces x $887.50 per oz = $232 billion / $877 billion national debt = 26.4%.
So in 1980, US gold holdings therefore amounted to 26.4% of US National debt. Remarkably similar to the percentage in 1934!
Gold Backing to US Debt Ratio “Reset” in 2018
In 2018 when this video was created, US National debt was $21,143 billion (i.e. $21.1 trillion).
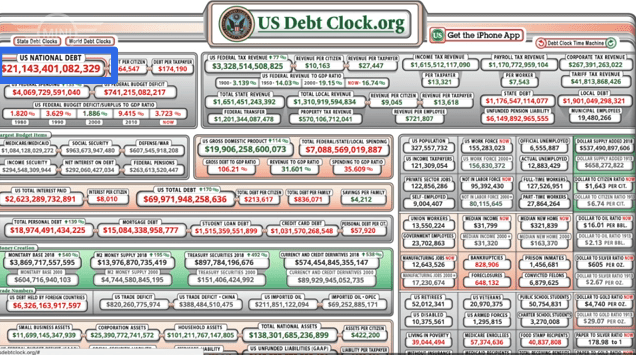
Via maneco64
US Gold reserves were reported to be 261.15 million ounces.
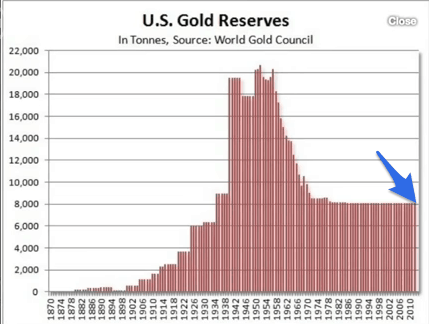
Via maneco64
So to achieve a 26% gold backing of the US debt in 2018, required a book value of US gold reserves of just under $5.5 trillion ($5,500 Billion).
In May 2018 the book value was $353 billion using the market gold price of $1,350. So to reach a 26% gold backing, the price of gold needed to increase 15.58 times. This came to a gold price of just over $21,000 per troy ounce.
How Have the Numbers Changed Since 2018?
Since 2018 US national debt has risen further:
- 2020: US national debt rose to $24.9 trillion.
- 2023: US national debt further increased to $33.7 trillion.
Throughout these periods, US gold reserves remained relatively stable at around 261.15 million ounces.
Therefore, to achieve a 26% gold backing for the US debt in each of these years, the gold price would have needed to reach:
- 2020: $24,866 per ounce
- 2023: $33,720 per ounce
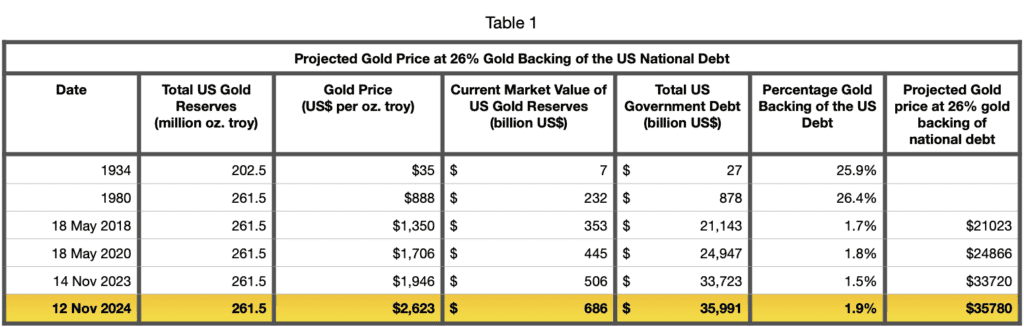
What Price Would Gold Need to Be Today to Match the 26% Gold Backing to Debt Ratio in 1934 and 1980?
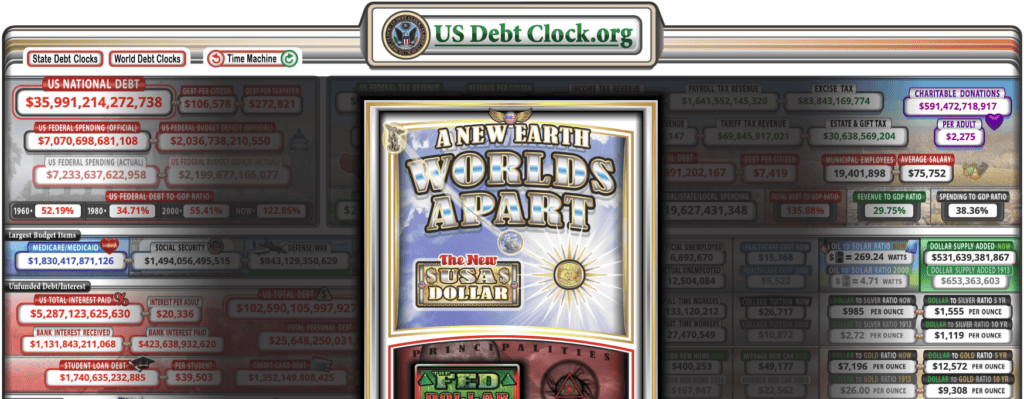
We are now just 1 year on from November 2023. But US national debt is up by $2.27 trillion in just 12 months to a massive $35,991 billion (i.e. $36 trillion). Higher interest rates have meant a large part of the US budget is now just merely going to service interest payments. Therefore debt is being used to pay for more and more government spending.
So how has this significant jump in US national debt affected the gold price required to achieve a 26% gold backing?
US Gold reserves are still reported to be 261.15 million ounces.
So today in 2024 to achieve a 26% gold backing of the US debt requires a book value of US gold reserves of $9.36 trillion. (i.e. 26% of $36 trillion).
Today the book value of the US gold reserves has also jumped quite substantially to $686 billion. Due to the significant increase in the gold price over the past year. (Today’s gold price of $2623 multiplied by 261.15 million ounces = $686 billion).
However even with this large jump in the price of gold, the gold backing of the US national debt is still only 1.9%.
Therefore to reach a 26% gold backing, the price of gold would need to increase 13.64 times. ($9.36 trillion or $9,360 billion divided by $686 billion = 13.64).
That is a gold price of $35,780 per troy ounce.
Key Takeaways:
- The rapidly increasing US national debt necessitates ever-higher gold prices to maintain a 26% gold backing.
- In just one year, from 2023 to 2024, the required gold price has risen significantly due to the ballooning debt.
- This trend highlights the potential impact of unchecked government spending and debt accumulation on precious metals like gold.
Conclusion
To match the historical gold backing ratios of 1934 and 1980, gold would need to trade at a staggering price of nearly $36,000 per ounce in 2024. This stark reality underscores the growing fiscal challenges faced by the US and the potential for gold to serve as a hedge against economic uncertainty.
The video creator rightly points out that there is no guarantee such a reset will happen. But nevertheless this does show that despite the recent rise gold remains very undervalued today. And there is an historical precedent for this.
Interestingly this is a quite similar number to that reached in this earlier article. Where we calculated the level the gold price would need to reach to 100% back the total assets of the Federal Reserve balance sheet: How Do You Value Gold | What Price Could Gold Reach? Updated 2024. This came to just over US$29,000.
Here is the full video…
Video: A Reset Like in 1934 and 1980 Would Mean $21,000 Gold
You might also be interested in: When to Buy Gold or Silver: The Ultimate Guide
Editors note: This article was originally posted 26 April 2018. Last updated 12 November 2024 with new debt figures and resulting gold price projection.
I presume all this is in US dollars which looks like about NZ$ 28,000. Perhaps I should buy some more, even if our Reserve Bank are not interested.
Pingback: How Do You Value Gold - What Price Could it Reach?
Pingback: Is it Too Late to Buy Gold? [Video] - Gold Survival Guide
Pingback: RBNZ Nearly Doubles QE to $60 Billion - More to Come? - Gold Survival Guide
Pingback: What Price Could Silver Reach? - Gold Survival Guide
Pingback: Clarification on Negative Interest Rates - Gold Survival Guide
Pingback: How Much is All the Gold in the World Worth? - Gold Survival Guide
Pingback: Will Biden's Tax Increases Mean No Inflation? - Gold Survival Guide
Pingback: 3 Contrarian Indicators Show it’s a Great Time to Buy Silver - Gold Survival Guide
Pingback: When Did New Zealand Switch to Fiat Currency? How Has the New Zealand Monetary System Changed Over the Past Century? - Gold Survival Guide
Pingback: Interest Payments on US Debt Tops $1 Trillion - Gold Survival Guide