Where Are We in the Psychology of the Silver Market Cycle?
This article looks at the phases of investor psychology in market cycles. Then compares these phases to the silver market cycle over the past 16 years or so, to see where the silver market is currently. Therefore helping to indicate where silver is going from here and aiding with deciding when to buy silver…
Table of Contents
Estimated reading time: 8 minutes
Psychology of a Market Cycle
This infographic from Wall St Cheat Sheet clearly spells out the emotions and feelings that investors experience as a market fluctuates. From depression, at the very bottom of a market, to euphoria at the top.
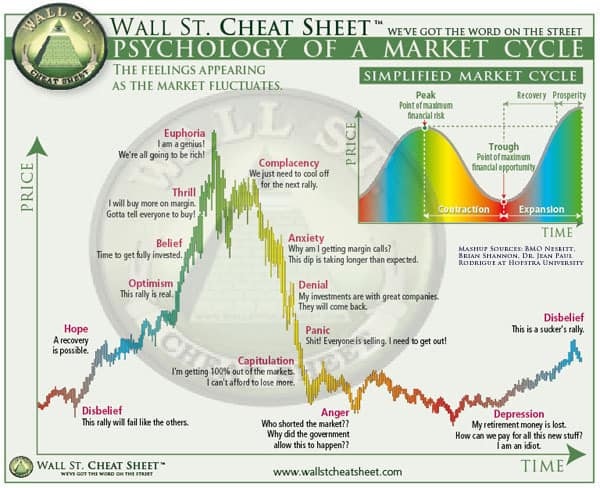
This got us thinking where are we in the psychology of the silver market cycle?
The Psychology of the Silver Market Cycle
Silver has not exactly been the outstanding performer in recent years. But it was a different story in the years leading up to 2011. So if you’ve been holding silver since 2011 you’ve possibly been through a roller coaster of investing emotions.
We’ve got a 20 year chart of silver in New Zealand Dollars below. Upon this we have added the emotions that silver buyers may have been through since the early 2000’s. These phases are inspired by the above infographic.
(Related:Gold and Silver Technical Analysis: The Ultimate Beginners Guide >>)
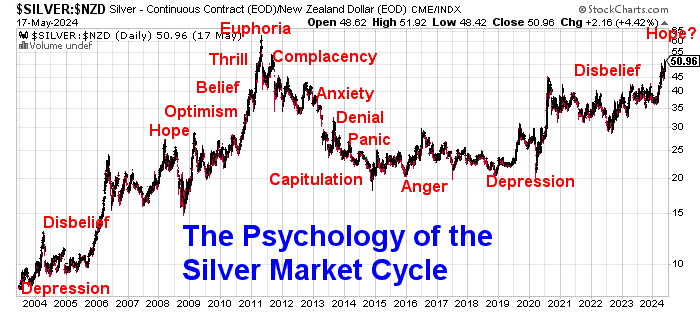
You can see that silver in New Zealand dollars has just about followed the cycle of emotions exactly since the early 2000s.
Silver was in depression mode in the early 2000s after going nowhere for years and years. We saw a rally in 2006, but it was one of Disbelief that we were seeing a real rise. Then rising through the emotions of Hope, Optimism, Belief and into Thrill and Euphoria as silver peaked in 2011.
Then we went through Complacency later in 2011, as silver rose after the initial sharp fall. Followed by Anxiety as the plunge resumed. Then Denial, Panic and Capitulation. Before silver bottomed out in late 2014/2015 with Anger.
Silver Finally Moves Out of Depression
In 2018 through to 2020 silver looked to have still been stuck in the Depression phase, even though the bottom most likely already occurred in 2014.
We saw the silver price rise since the 2014 low, but only in a slight uptrend. This uptrend was further obfuscated by the fact that silver returned to the same lows in 2016, 2017 and 2018 and finally in 2020. It was just a long slow sideways churning grind – the perfect example of Depression.
While silver didn’t make a new major low during this period, it didn’t reach a new high until later in 2019.
Therefore most people simply didn’t believe silver would ever manage to rise much higher.
So with the benefit of hindsight we can say silver had a quite protracted time in the Depression phase. With a sharp fall in 2020 all the way down to $12 per ounce, due to the COVID-19 crash in just about all markets. But then finally the sharp bounce that followed likely saw silver move out of the Depression phase.
However, 4 years of sideways correction, from late 2020 up until earlier this year in 2024, likely has caused many people to think silver was never heading higher. So that makes us think it has been in the Disbelief phase through the past 4 or so years.
Sentiment towards silver has remained very poor. Even in the recent rally in March and April 2024, there has been little retail buying. Premiums above spot price have also remained very low. We have also seen a lot of selling in silver in this recent rally. This all points to a lack of belief in the silver market.
So we’re tempted to say silver has remained in the Disbelief phase up until now. Because Disbelief simply means that the rise in price is not expected to be sustainable. So there are few people “on board”. Simply because the majority expects the rise to be temporary.
(For more on the topic of precious metals cycles see: Gold Cycles vs Property Cycles: When Will Gold Reach Peak Valuation?)
Where to From Here for the Silver Cycle?
So that was the psychology of the silver market cycle from 2009 to 2024. Where to from here for silver?
Currently Edging into the Hope Phase for Silver?
With NZD silver now breaking out to reach the highest price in over 12 years, we might be close to entering the Hope phase. The Cheat Sheet explanation of the feeling during Hope is: “A recovery is possible”. We don’t think we’re quite there yet, but it might be getting close. Although we wonder if it will take a rise back above the 2011 all time high in order to truely break through into Hope?
The past 4 year sideways churn has likely resulted in quite negative sentiment towards silver. Along with likely quite reduced levels of hope. While we had a rise in 2020, a lot of doubt likely still exists about whether silver can continue to climb. Instead many will think this latest surge is just a short term rise before silver peaks and heads down again.
This is exactly where a longer term rise in price is often achieved.
So maybe we will once again be in the phase in the silver market cycle where, after going nowhere for a while, we instead see a sustained rise in the silver price.
Cup and Handle Pattern Suggests Higher Silver Prices Ahead
There is also an interesting pattern playing out that suggests much higher prices ahead. Dating all the way back over 40 years.
The chart below depicts a very long term “cup and handle” pattern in play for silver. (Note: It is silver in US dollars as stockcharts doesn’t have data for NZD silver that goes back that far. Although it would look fairly similar in NZ dollar terms too).
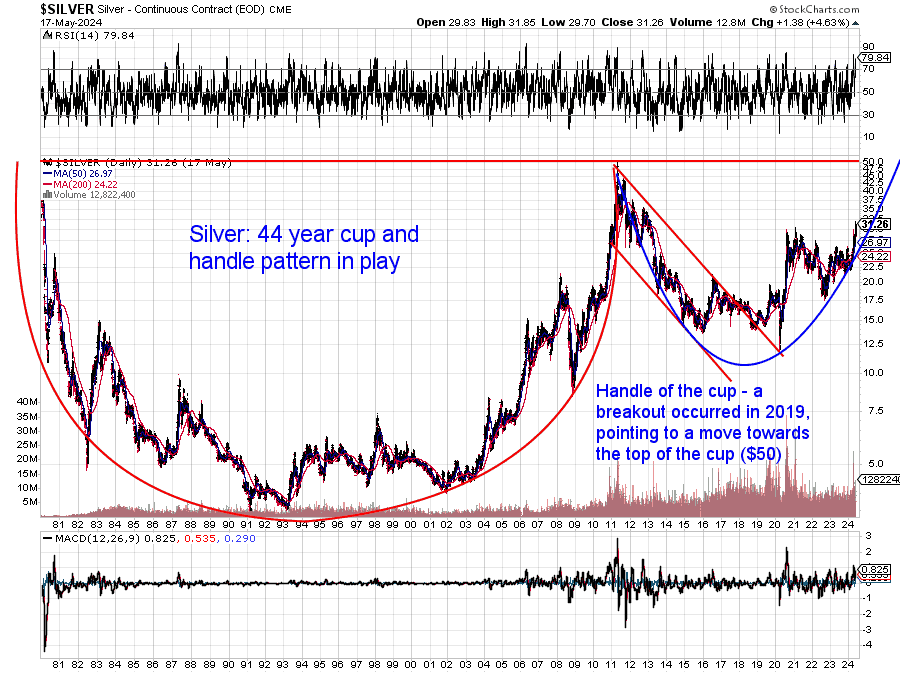
A cup and handle pattern is a bullish continuation pattern. Simply put this means a rising trend that has taken a breather but looks like continuing.
This silver chart is a near perfect example of this trading pattern. USD Silver made a “double top” high at $50. First in 1980, then reached the same level silver in 2011. This “U’ shaped pattern is the “cup”. Then over the next 8 years, silver looks to have formed the “handle” of the cup. Where the price fell back in a downwards trending channel (between the 2 red downtrend lines). Then in 2019 silver broke out from the falling channel that was the handle. In March of 2020, silver retested this breakout, before a sharp rise through to August 2020.
The sideways churn since then has seen silver start to rise up the right hand side of the “handle”.
The pattern will not be complete until the $50 mark is broken. After a 4 year consolidation, could silver now be ready for a further up leg towards $50? The blue parabola (U shape) in the chart traces out a potential pattern for a move towards $50. The fact that silver has also just this past week broken above the 2020 high of US$30 adds weight to this argument.
What is the Price Target for Silver Now?
There are different theories as to how high the next move might be, after the top of the cup is exceeded.
- It will the height from the bottom of the cup to the top. In the case of silver this would be around US$46 (i.e. US$50 – US$4). So the move higher after the pattern is complete would take silver up to US$96.
- It will be the same as the retracement in the handle. So from the top of the cup (US$50) down to US$12 would be US$38. That would indicate a move up to US$88.
Neither of these are guaranteed, but this pattern does indicate a very high probability of significantly higher prices ahead for silver.
So this pattern on top of the emerging “hope” phase (albeit very limited hope!) for silver also makes now a solid time to buy silver. There are plenty of options in silver currently but you can see what silver coins are available here.
Or for the best value silver check out the silver bars here.
Or for more help in deciding when to buy silver (or gold) see: When to Buy Gold or Silver: The Ultimate Guide >>
Editors Note: This article was first published on 12 December 2017. Last updated 21 May 2024 with updated charts for “Psychology of the Silver Market Cycle” and the cup and handle pattern.
Pingback: Latest on the COMEX Silver CoT Report - Gold Survival Guide
Pingback: Why Will Gold Still be Valuable in the Future? - Gold Survival Guide
Pingback: RBNZ Currency Printing Continues on Schedule - Gold Survival Guide
Pingback: Is This Corrective Wave Down in NZD Gold About to End? - Gold Survival Guide
Pingback: Should We be Calling For an Inquiry into the RBNZ’s Response to Covid? - Gold Survival Guide
Pingback: USD Silver Breaks Above Key $30 Mark - 12 Year High - Gold Survival Guide