Prices and Charts
NZD Gold Barely Changed From a Week Ago
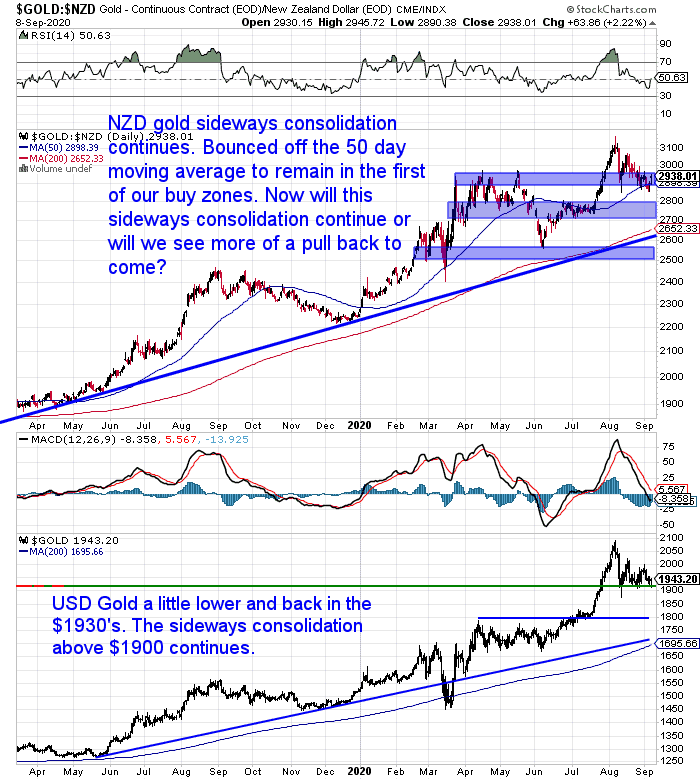
Gold in New Zealand Dollars has barely changed from last week. It did dip lower under the 50 day moving average (MA), but today has jumped back up into the middle of the recent sideways trading range.
In US dollars gold also continues to meander sideways. This sideways consolidation is looking very positive. Instead of a large fall, the heightened interest in gold is being burnt off by this boring sideways action. The price has already met the 50 day moving average simply by going sideways. It could continue to do the same and will end up close to the 200 day MA.
This boring sideways action could then well lead us into the next upleg. It is noticeable that there has been less buying in the past couple of weeks as a result of this. As we’ve mentioned before, people don’t like to buy when there is no clear direction. But this does serve to take the focus off gold, without a large fall taking place.
So to us this lack of a large pullback is (so far anyway) looking quite impressive for gold.
Silver Forming a Pennant or Flag Pattern
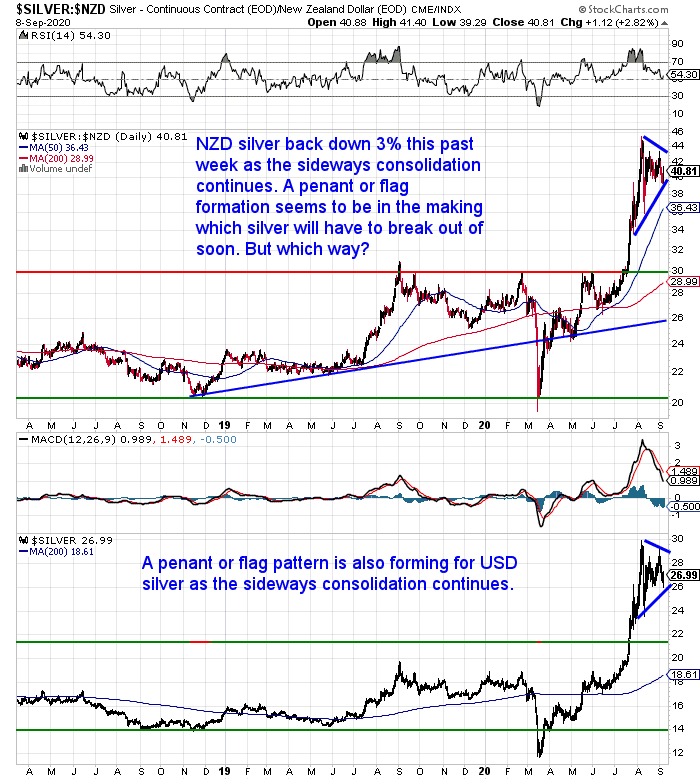
Silver is also yet to see a more serious pullback. Silver is drawing out a different pattern to gold though. Creating a pennant or flag formation. This simply means the price is compressing into a smaller trading range. A range that silver will have to break out of before too long.
Technical analysis says that on average the breakout is more likely to follow the direction of the prior trend. In this case that would be up. But technical analysis is much more art than science. So we shall wait and see.
However like gold, the lack of a more serious pullback after such a powerful move higher is so far looking very positive for silver.
NZD Breakout or Fakeout?
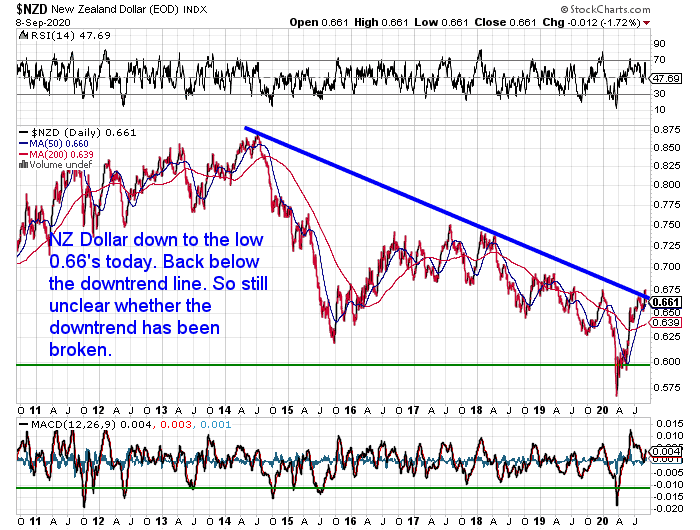
Last week the New Zealand dollar poked its head up above the downtrend line. In our daily alerts we had been saying it was too early to say it was a clear change of trend. So far that looks to be the case. As today the Kiwi is back down below the trend line from 2014.
So it’s still not clear whether this was a break out… or a fakeout.
Need Help Understanding the Charts?
Check out this post if any of the terms we use when discussing the gold, silver and NZ Dollar charts are unknown to you:
Continues below
—– OFFER FROM OUR SISTER COMPANY: Emergency Food NZ —–
NEW: Certified Organic Long Life Emergency Food
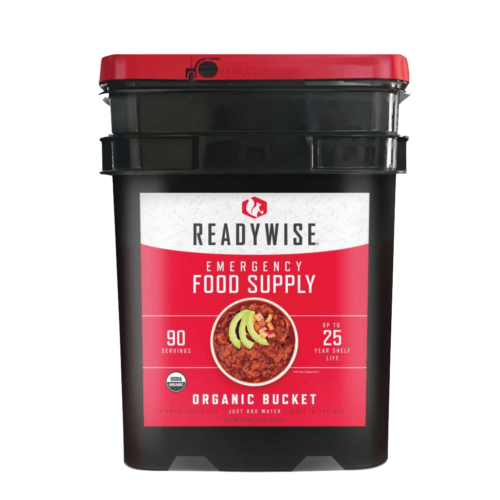
This easy to carry bucket has 90 servings of organic breakfasts and mains
Free Shipping NZ Wide
Get Peace of Mind For Your Family NOW….
—–
Question: Silver OutPerforming Gold in 2020 due to Industrial Demand?
Last week we pointed out how…
“Since the start of August, gold is down almost 2%. While Silver is up almost 13% in the same period.
This out-performance by silver is shown by the gold to silver ratio chart. It reached a new low this week under 70. So it only takes 69 ounces of silver to buy an ounce of gold.
For silver to do so much better than gold during a correction or consolidation is quite unusual. Usually when the precious metals sector undergoes a correction, silver falls further than gold. Generally this is because silver rises much further than gold in the prior run up.
We’re not sure what to make of that exactly. Could it be signaling a change of fortune for silver after years of under-performance?”
A reader responded:
“Robert Kyosaki predicted Silver could possibly supercede the price of Gold in the year 2020.
This is because China and India are now producing Electronics and (Short Supply Silver) is the conductor they use on circuit boards.
Perhaps this explains why Silver is outperforming Gold?”
Here was our reply:
Personally we think it might actually be the opposite of this. That is silver’s monetary characteristics are starting to come to the fore now.
We’ve written about this before here: Could Silver be Worth More Than Gold?
More people may also be starting to worry about the potential for inflation down the road.
But we’d say it’s unlikely silver will be worth more than gold mainly due to what is called the stocks to flow ratio. The above article also discusses that.
That said the industrial uses for silver have been increasing as the above article also discusses. So it could be we are approaching the “perfect storm” where there is rising industrial and monetary/safe haven demand.
We then received the below follow up reply from our reader:
“Thanks for your fast response. I usually read or at least skim through all of your emails since I subscribed, I don’t recall seeing this one. Very educational like all nonetheless. I do kick myself in the arse for having not invested yet (been watching for 3+ years), but paying down bad debt has been my primary priority, perhaps I have been going about things the wrong way, time to rethink.”
Well no one went broke having no debt that’s for sure. So we don’t think our reader should feel too bad. Hindsight is 20/20 after all.
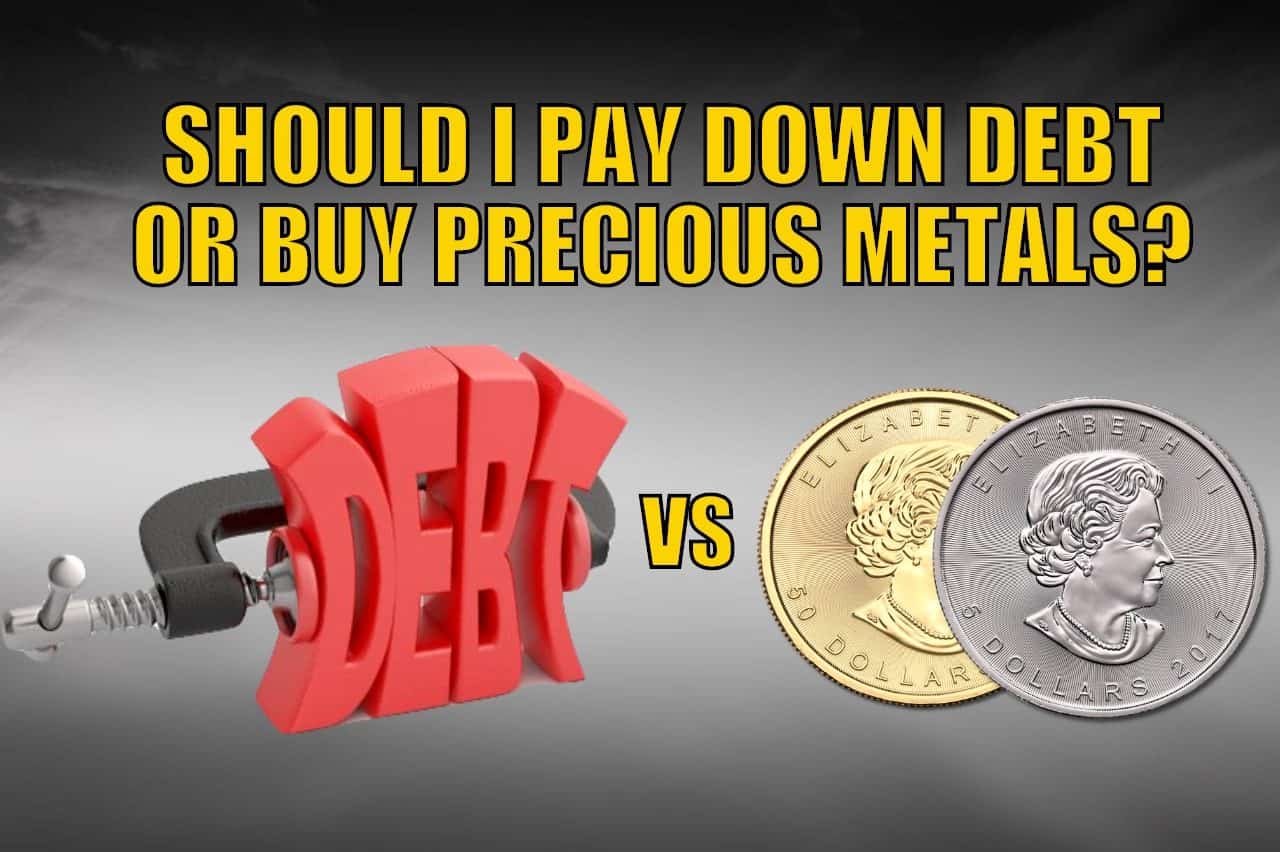
But this is nonetheless an age old question – pay down debt or invest?
In light of the even lower mortgage interest rates we now have, this question is worth considering.
Here’s some factors to take into account. Along with 3 potential scenarios to consider…
RBNZ Currency Printing Continues on Schedule
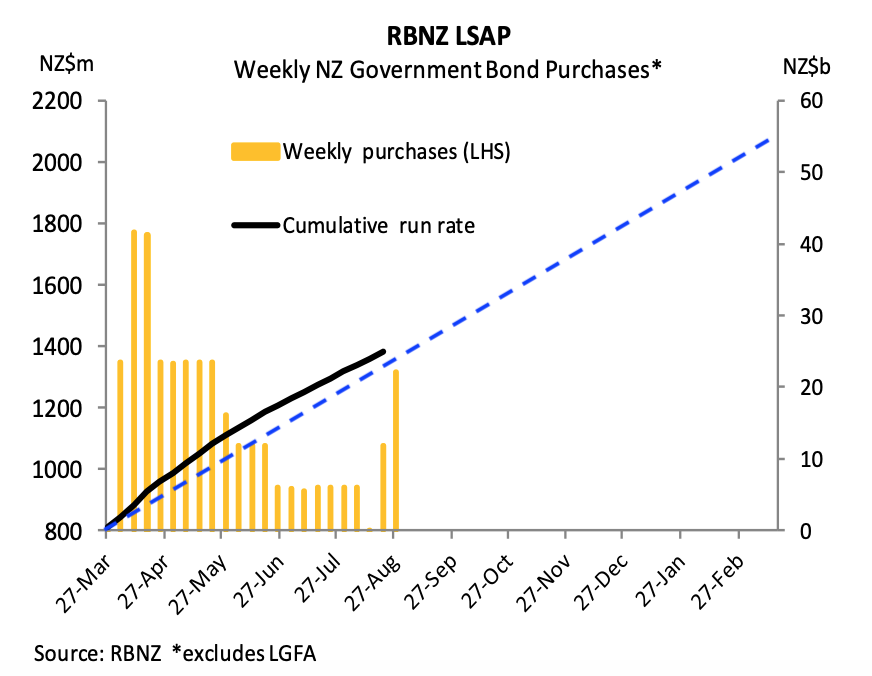
The latest ASB chart pack shows that the NZ central bank’s currency printing remains on schedule to reach $60 Billion. The latest lockdown resulted in a large jump in weekly purchases as shown in the chart below. We’ve added a blue trend line to show where the cumulative purchases would need to be to remain on track for $60 Billion by May 2021. (ASB used to have this on the chart – not sure why it was removed).
The RBNZ remains well above this line. As we have been saying, now that they’ve joined the currency printing brigade, it will be pretty difficult to leave that club. So odds are the $60 billion limit (which has already been increased twice since it was started in March) will be increased again.
Your Questions Wanted
Remember, if you’ve got a specific question, be sure to send it in to be in the running for a 1oz silver coin.
ASB: Expect Negative Interest Rates in New Zealand in April 2021
ASB economist Nick Tuffley this week said they expect negative interest rates in New Zealand in April 2021.
“To promote economic activity, Tuffley says the Reserve Bank (RBNZ) will likely drop the official cash rate (OCR) to below zero for the first time. They’re already at a record low of 0.25 percent, but ASB’s picking them to fall to -0.5 percent.
“Our change in view is due to the RBNZ’s apparent willingness to move the OCR lower after its current forward guidance expires, along with our conviction that current monetary settings do not offer enough economic support. We have pencilled in the first RBNZ rate hike for early 2023, but admit the timing is highly uncertain.”
Source.
What Would Negative Interest Rates Mean for New Zealand?
In case you missed this, back in May we answered a number of readers questions on the topic of negative interest rates in NZ.
What Would Negative Interest Rates Mean for New Zealand?
So if you’re still umming and ahhing about whether to buy gold and silver, the prospect of negative interest rates, and therefore zero returns from your bank account, should be a pretty good incentive.
Please get in touch with any questions you may have.
- Email: orders@goldsurvivalguide.co.nz
- Phone: 0800 888 GOLD ( 0800 888 465 ) (or +64 9 2813898)
- or Shop Online with indicative pricing
— Prepared for the unexpected? —
Here’s how to always have clean fresh drinking water on hand.
Back in Stock Again:
The Sport Berkey Water Filter Bottle – $69 Delivered
Ideal for travel. Driving, camping, backpacking.
Free Shipping NZ Wide.

—–
|
Pingback: Gold is a Composting Toilet? - Gold Survival Guide
Pingback: What Use Will Silver Coins be in New Zealand in a Currency Collapse? - Gold Survival Guide