The below charts show the spot prices and historical prices for gold and silver in New Zealand dollars & US Dollars. (See here for a definition of the spot price) They are not used to generate any gold or silver quotes. Visit our bullion order page if you’d like to see indicative prices to actually buy gold and silver bullion.
Gold Prices, Silver Prices & Charts
GOLD PRICES, SILVER PRICES & CHARTS

Are You Checking Gold and Silver Spot Prices in NZ Dollars Regularly?
Save time - get a gold and silver price alert in NZ & US dollars to your inbox each week day! [Learn More]
Note: It is our responsibility to protect your privacy and we guarantee that your data will be completely confidential.
Live Spot Gold Price & Spot Silver Price in NZ Dollars
Live Spot Gold Price in New Zealand Dollars

Live Spot Silver Price in New Zealand Dollars

Historical Gold Price Charts in NZ Dollars
24 Hours Gold Price Chart in NZ Dollars – per ounce

24 Hours Gold Price Chart in NZ Dollars – per gram

30 Day Gold Price Chart in NZ Dollars – per ounce

60 Day Gold Price Chart in NZ Dollars – per ounce

1 Year Gold Price Chart in NZ Dollars – per ounce

5 Year Gold Price Chart in NZ Dollars – per ounce

10 Year Gold Price Chart in NZ Dollars – per ounce

20 Year Gold Price Chart in NZ Dollars – per ounce

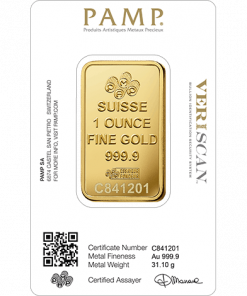
Featured Gold Products and Deals
$4,109.02
$4,215.85
New
Out of stock
Historical Silver Price Charts in NZ Dollars
Live 24hr Silver Price Chart in NZ Dollars – per ounce

Live 24hr Silver Price Chart in NZ Dollars – per kilogram

30 Day Silver Price Chart in NZ Dollars – per ounce

60 Day Silver Price Chart in NZ Dollars – per ounce

1 Year Silver Price Chart in NZ Dollars – per ounce

5 Year Silver Price Chart in NZ Dollars – per ounce

10 Year Silver Price Chart in NZ Dollars – per ounce

20 Year Silver Price Chart in NZ Dollars – per ounce

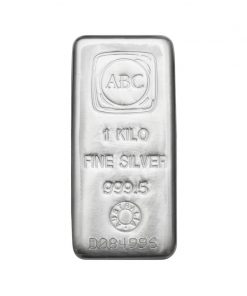
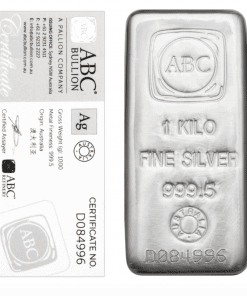
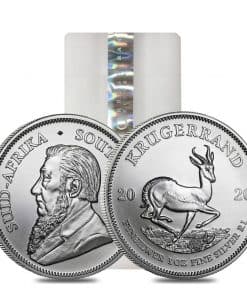
Featured Silver Products and Deals
$1,656.67
$1,459.03
$25,912.13
New
$5,133.07
Gold Price Charts in US Dollars
Live 24 Hour Gold Spot Price Chart - US dollars

Gold Price Charts for 1 and 5 years in US Dollars


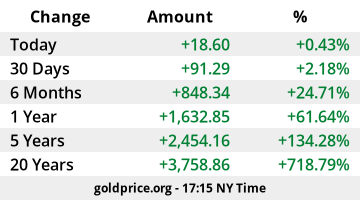
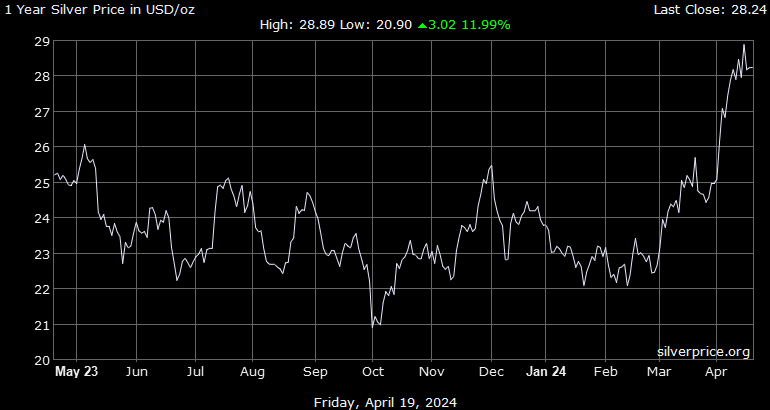
Silver Price Charts in US Dollars
Live 24 Hour Silver Spot Price Chart - US dollars


Silver Price Charts for 1 and 5 Years in US Dollars

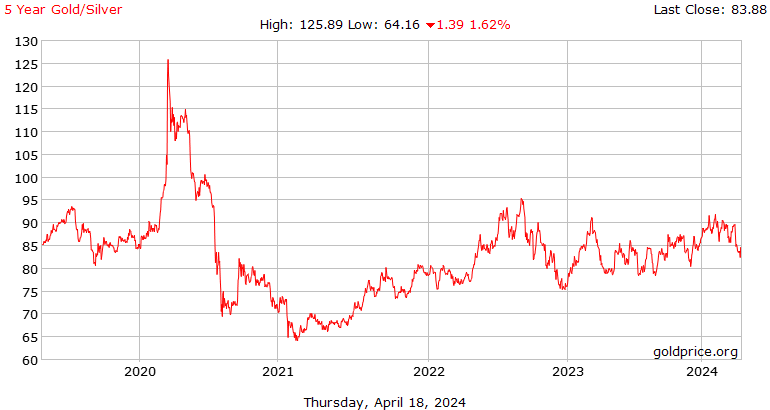
Gold Silver Ratio Charts
Gold Silver Ratio Chart - Daily Closing for 5 years and 10 years