This Week:
- Weekly Price Overview – 27 August 2025
- What Happens to the NZ Dollar When the US Dollar Dies?
- Banks Still Underwater — Why Central Banks Blink
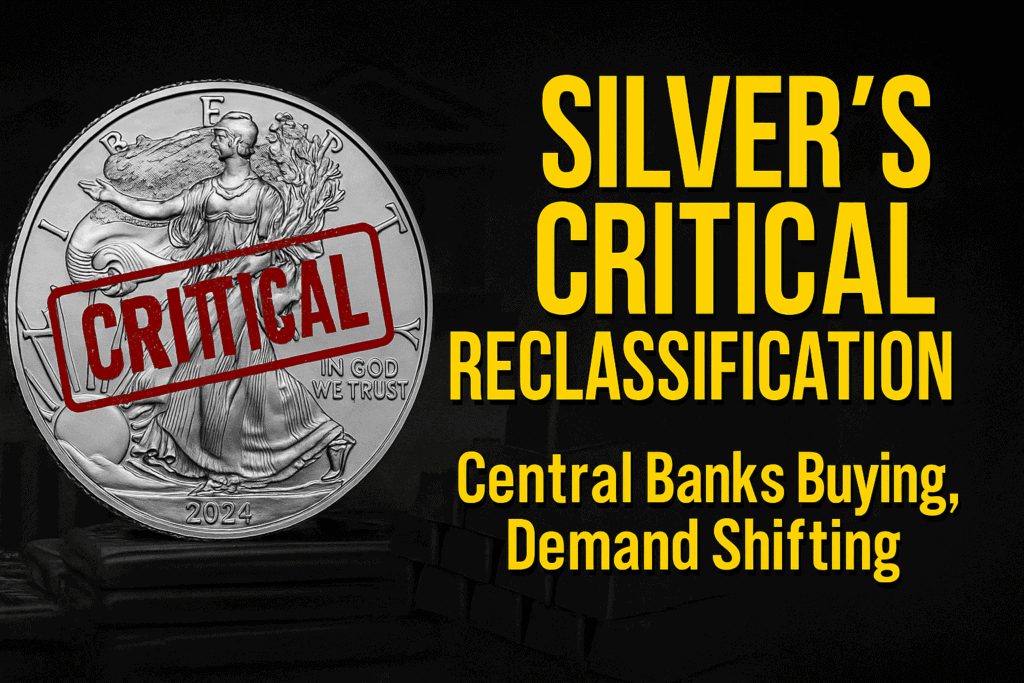
- Silver: Critical Reclassification, Central Bank Buying & Demand Shifts
- Meme of the Week: Oblivious Today, Buyers Eventually
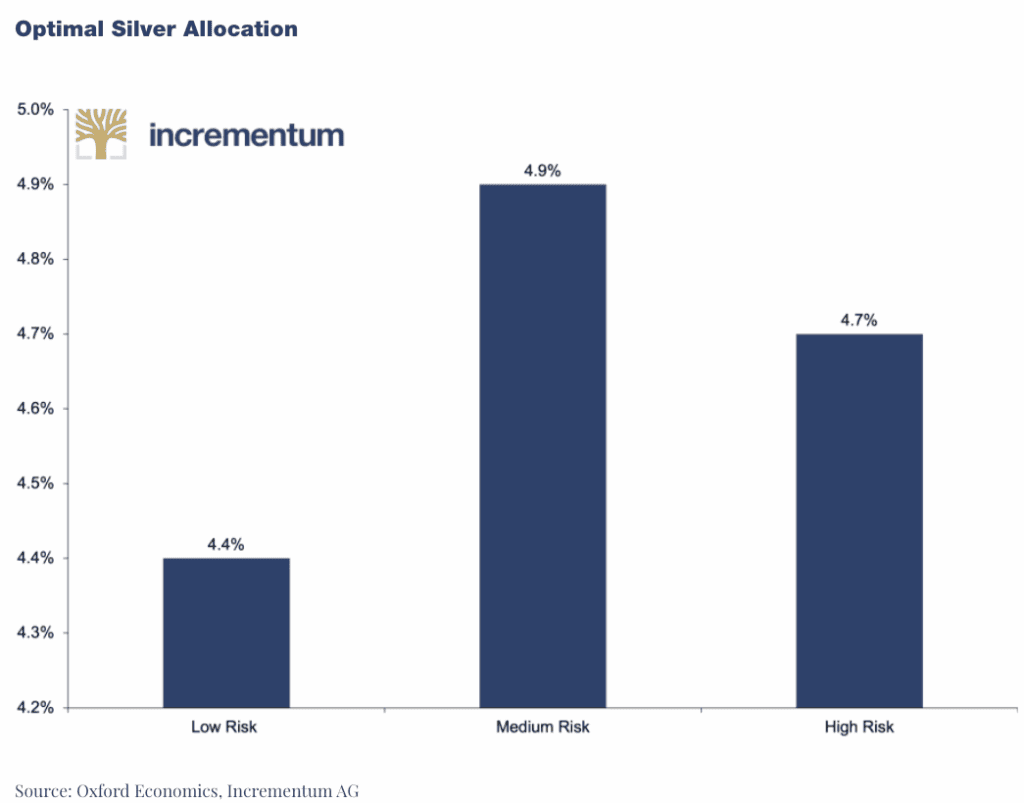
- Chart of the Week: Optimal Silver Allocation
Estimated reading time: 7 minutes
Weekly Price Overview – 27 August 2025
Both gold and silver pushed higher this week, with silver again showing stronger momentum. NZD/USD weakened, helping lift local prices.
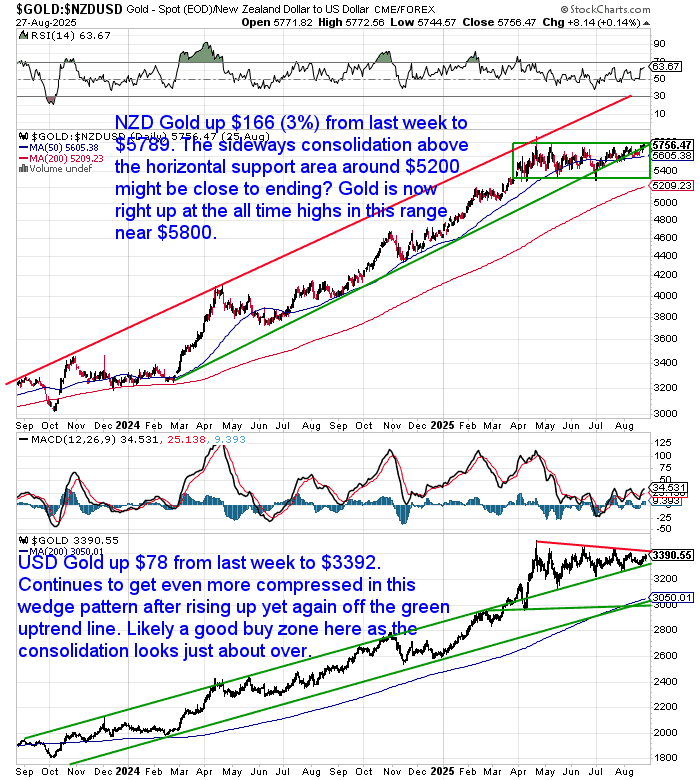
🟡 NZD gold rose $166 to $5,788.57 (+2.94%), pressing back to its all-time highs near $5,800. USD gold added $78 to $3,392.10 (+2.35%), with consolidation looking close to breaking higher.
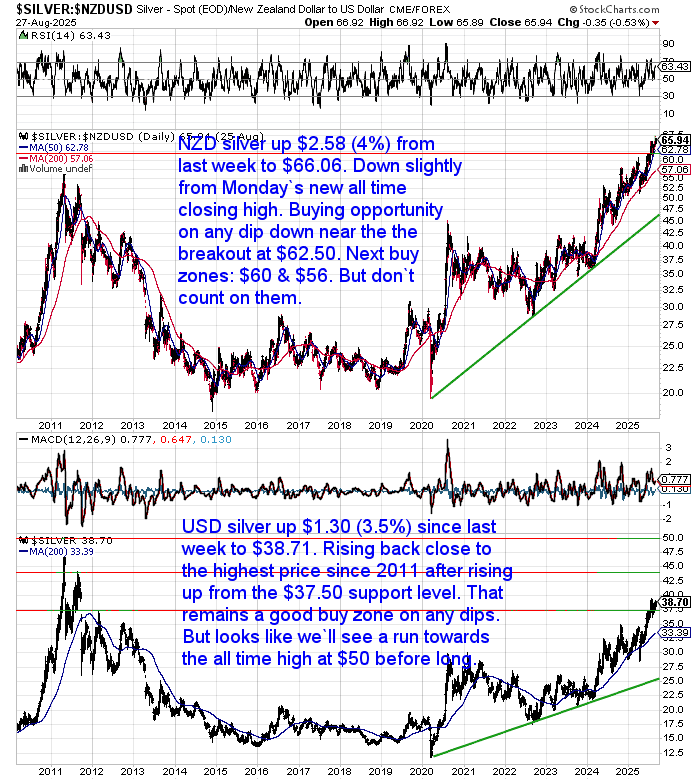
⚪ Silver outperformed once more. NZD silver climbed $2.58 to $66.06 (+4.06%), just below its record high. USD silver jumped $1.30 to $38.71 (+3.46%), with $50 in sight as the next big target.
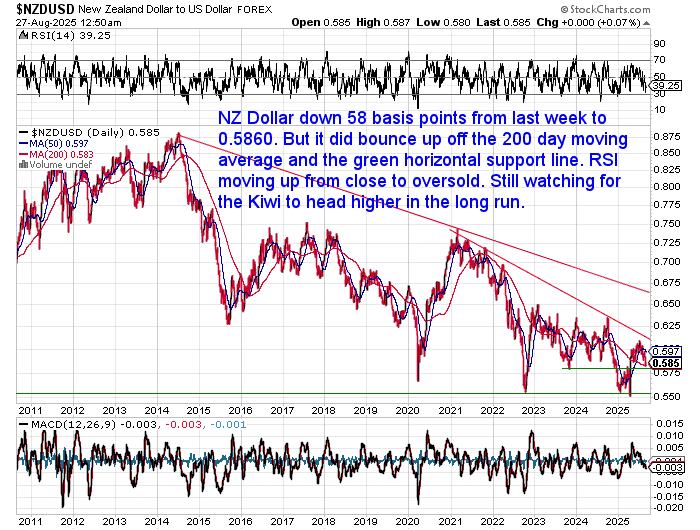
💱 The NZD fell 0.58% to 0.5860, bouncing off support but still in a longer-term downtrend. A weaker Kiwi adds tailwinds for NZD-priced metals.
📈 Technicals show gold consolidating near record levels while silver has hit a new all time (NZD) high . Dips remain buying opportunities, particularly in silver, which continues to set up for a run at historic (USD) highs.
What Happens to the NZ Dollar When the US Dollar Dies?
Over the past century, the US dollar has become the world’s dominant currency. But what happens if that dominance collapses? In this week’s feature article, we explore how a failure of the US dollar might affect the New Zealand dollar — and your savings. Few Kiwis consider this — but the implications are real. Here’s what to watch and how to prepare…

Banks Still Underwater — Why Central Banks Blink
The chart below shows U.S. banks are still carrying hundreds of billions in unrealised losses on their bond holdings — even worse than during the Global Financial Crisis. Higher interest rates have left them deeply underwater.
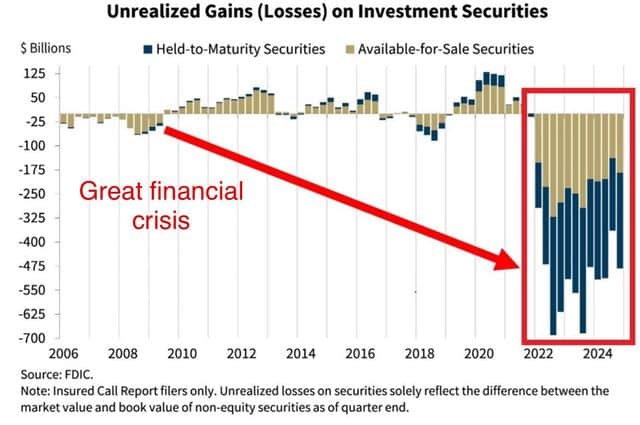
It’s no wonder then that at Jackson Hole, Fed Chair Jerome Powell hinted rate cuts may soon be on the way. The Fed knows that “higher for longer” risks breaking the banking system. Cutting rates is the easy way out — it relieves pressure on banks and markets, even if inflation isn’t fully back under control.
We’re seeing the same story here in New Zealand. ASB pointed out last week that the RBNZ, after cutting the OCR to 3%, is now signalling further easing. Just a few months ago, the Bank was fretting over sticky inflation. Now that caution seems to have been cast aside, with (misplaced?) confidence that spare capacity and rising unemployment will mop up the problem instead.
The pattern is clear: when choosing between financial stability and inflation, central banks blink. That avoids short-term pain, but history shows it tends to set us up for bigger trouble later.
Ronni Stoeferle points out that for investors this is the equation:
𝐑𝐞𝐬𝐭𝐫𝐢𝐜𝐭𝐢𝐯𝐞 𝐫𝐚𝐭𝐞𝐬 + 𝐟𝐫𝐚𝐠𝐢𝐥𝐞 𝐠𝐫𝐨𝐰𝐭𝐡 + 𝐬𝐭𝐢𝐜𝐤𝐲 𝐢𝐧𝐟𝐥𝐚𝐭𝐢𝐨𝐧 = 𝐚 𝐛𝐚𝐜𝐤𝐝𝐫𝐨𝐩 𝐰𝐡𝐞𝐫𝐞 𝐠𝐨𝐥𝐝 𝐬𝐡𝐢𝐧𝐞𝐬 𝐛𝐫𝐢𝐠𝐡𝐭𝐞𝐬𝐭.
Silver: Critical Reclassification, Central Bank Buying & Demand Shifts
There’s been a flood of significant silver news this past week.
Firstly, the U.S. Department of the Interior has now reclassified silver as a “critical” mineral. That might not sound like much, but it’s an early warning signal to investors. Washington clearly sees silver as strategically important for the years ahead.
Then came headlines out of Saudi Arabia. Reports suggest the Saudi Central Bank — or more likely its sovereign wealth fund — has bought around $30–40m of silver and silver miners. In dollar terms it’s small, but it’s still notable because central banks have historically focused almost exclusively on gold. While Russia has openly said it is adding silver to reserves, and Mexico holds some due to its role as the world’s top producer, Saudi interest shows the idea of silver as a monetary or strategic asset is spreading. If more institutions follow, it could mark the start of a shift in how silver is viewed at the reserve level.
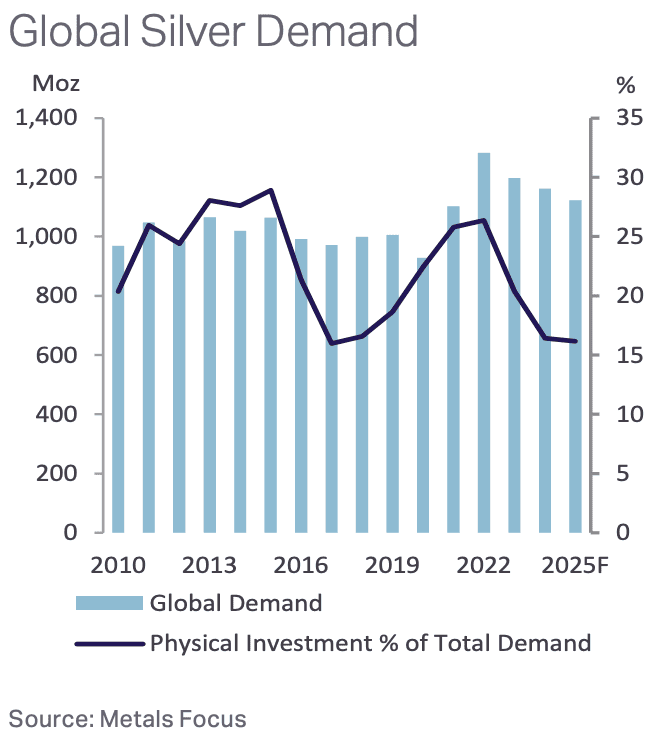
Meanwhile, the Silver Institute released an excellent report on the state of physical investment markets. The chart below shows that global physical investment as a share of demand is back down to 2016 levels. In the U.S., much of the 1.5bn ounces bought over the past 15 years is still held. But new buying has slowed in 2024–25, hitting a seven-year low.
Source: The Silver Institute
And yet, silver’s fundamentals remain striking:
- The market is in its 5th straight annual deficit, nearly 800m ounces short since 2021.
- Industrial demand hit a record 680m ounces in 2024, thanks largely to solar.
- Allocation to silver remains tiny compared to gold — just 0.03% of global wealth vs an “optimal” 4–5% according to Oxford Economics. Source: In Gold We Trust Report
It’s no wonder the In Gold We Trust report suggested silver is “quietly setting the stage for a major revaluation”. With persistent deficits and such tiny portfolio exposure, even modest new buying could drive prices sharply higher.
“Bank of America states that “moving just 1% of global reserve assets into silver would be equivalent to 5 years’ worth of silver supply”. Moreover, if approximately 1% of the entire global population bought 10 oz of silver, the annual silver production would be totally consumed.”
The white metal remains both an industrial necessity and a monetary asset — a unique combination that makes it one to watch very closely from here.
Meme of the Week: Oblivious Today, Buyers Eventually
Most people ignore gold until it’s already much higher — then they finally rush in. The Silver Institute report shows a similar pattern in silver today. Physical investment demand has fallen back to 2016 levels, meaning very few are buying right now. History suggests when the crowd does show up, prices will already be far higher.
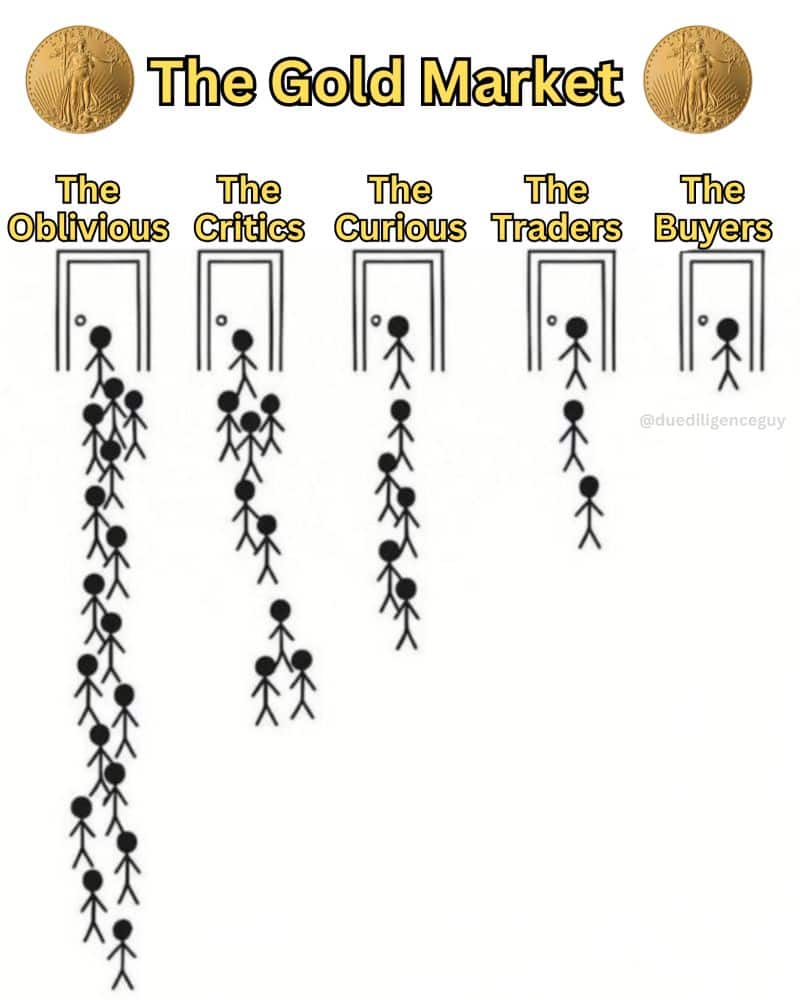
Chart of the Week: Optimal Silver Allocation
This week’s chart shows Oxford Economics’ suggested portfolio allocation to silver: roughly 4–5%, depending on risk tolerance. Compare that to the real world, where silver makes up only a fraction of a percent of global wealth.
So, is 5% of your portfolio in silver?
If not, please get in touch for a quote or with any questions.

