Gold and silver prices surged again this week, powered by continued weakness in the NZ dollar and strong global momentum — especially for silver. Both metals are now testing or breaking into new high territory, with dips looking increasingly buyable.
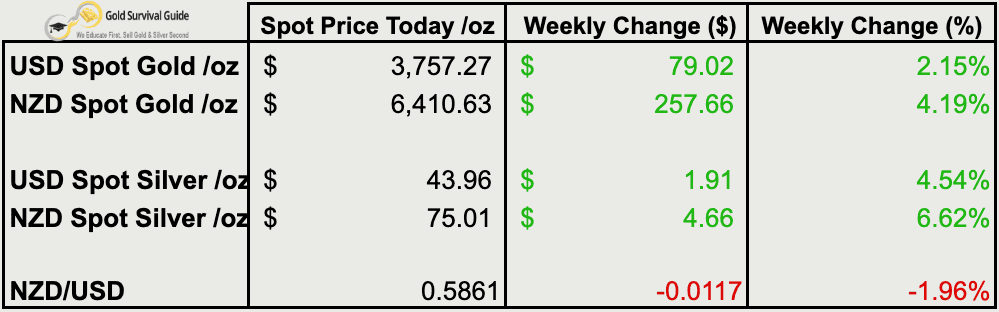
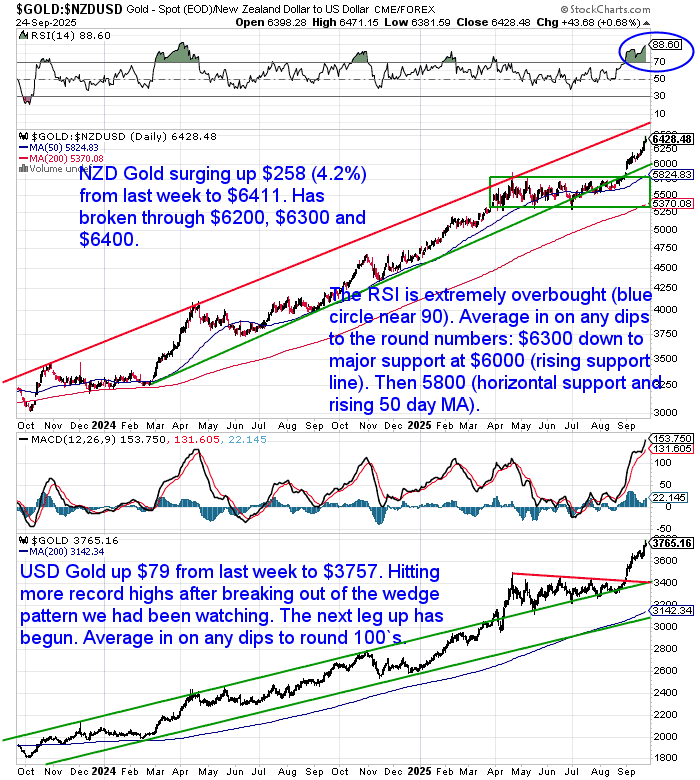
🟡 NZD gold jumped $257.66 to $6,410.63 (+4.19%), breaking through multiple key round-number resistance levels ($6200, $6300, $6400). USD gold rose $79.02 to $3,757.27 (+2.15%) and remains in breakout mode.
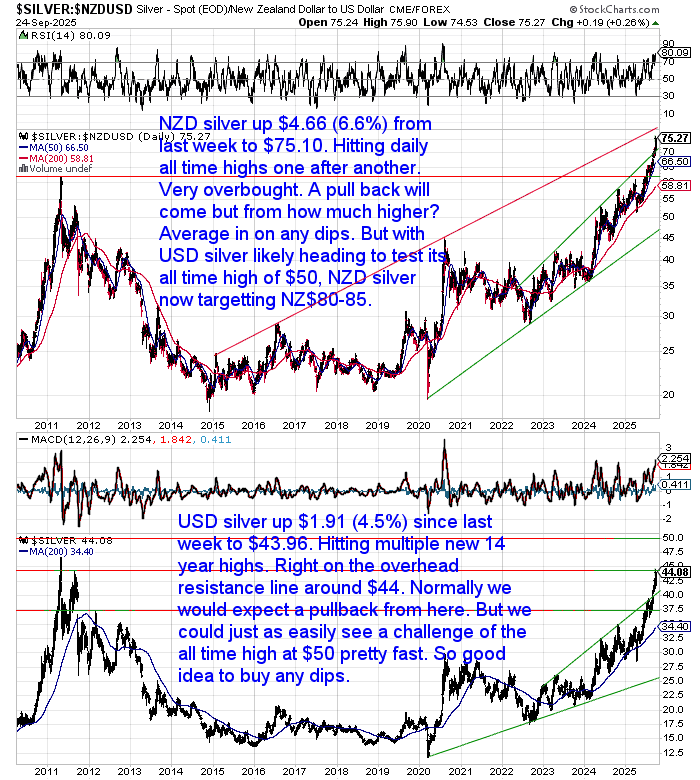
⚪ NZD silver soared $4.66 to $75.01 (+6.62%), notching yet another new all-time high. USD silver surged $1.91 to $43.96 (+4.54%), closing in fast on the psychologically important $50 level.
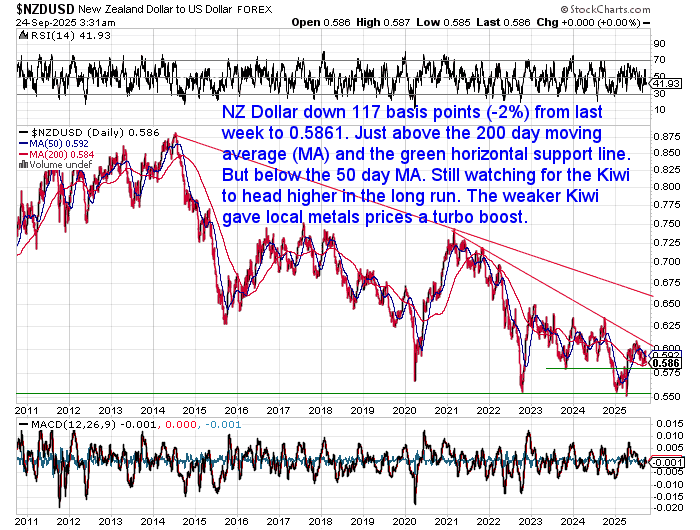
💱 NZD/USD dropped -1.96% to 0.5861, delivering a tailwind for local metals prices. It broke below the 50-day MA but held the 200-day MA for now. Trend still supportive.
📈 Momentum remains strong, especially for silver. As long as USD silver stays above $40, and NZD gold holds $6000+, the uptrend remains intact — and any pullbacks still look like long-term buying opportunities.
Silver will see a decent pullback at some stage, but that could be from even higher levels than we are now at. Consider averaging in on any dips.
The World’s Buying Gold. Silver’s Breaking Out. But Central Banks Say Inflation’s Fine?
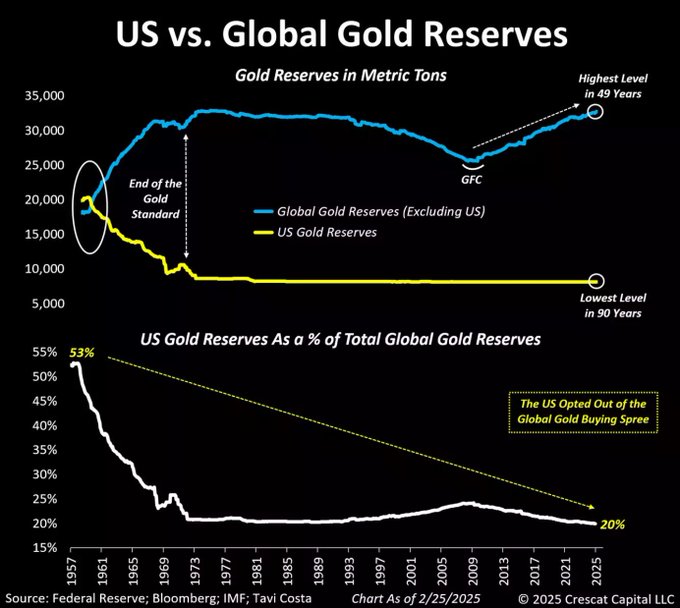
This week’s price moves in gold and silver aren’t happening in isolation. Tavi Costa’s latest charts show the US has opted out of a global gold rush — while the rest of the world now holds the highest reserves in 49 years. Tavi says:
“How long can America afford to sit out the global rush for gold?
US gold reserves are now at 90-year lows, while the rest of the world has pushed their holdings to near 50-year highs.
At one point, America held over 50% of global gold reserves.
Today? Just 20%.
My view:
It’s only a matter of time before US policymakers are forced to rethink this stance.”
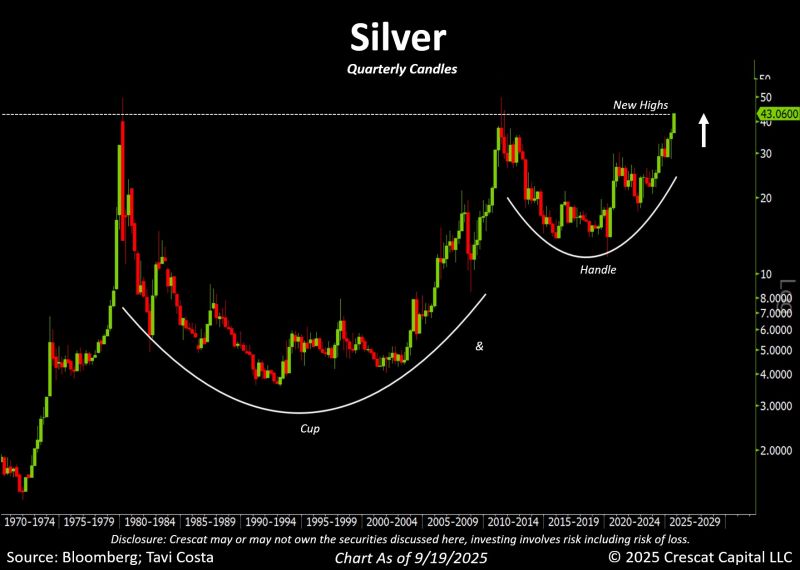
Meanwhile, silver looks ready to post its highest quarterly close ever, forming one of the most textbook bullish technical patterns around: the cup and handle.
“With just 7 days left in the quarter, silver is on track to post its highest quarterly close in history.
If this closing level holds, it could mark a major technical breakout — cup-and-handle formations like this often precede sharp, sustained moves once all-time highs are breached.
Of course, do your own due diligence, but this setup is one of the most compelling I’ve seen in the space.”
And yet… back in New Zealand, ASB just forecast inflation will drop below 3% — with the RBNZ saying spare capacity will help push CPI back toward 2%.
But while central banks sound optimistic, markets say: inflation isn’t dead — it’s just better hidden. And as more currency creation gets priced in, metals are responding loud and clear.
Meme of the Week: Stagflation Coming into Focus
Add in slowing growth and elevated prices, and this meme of the week feels about right:
They’re not saying “stagflation” yet — but they’re starting to see it more clearly.
Whether you’re buying dips or planning a bigger move, we’re here to help you think it through. Just hit reply — we always enjoy hearing from smart readers.