This Week:
Estimated reading time: 6 minutes
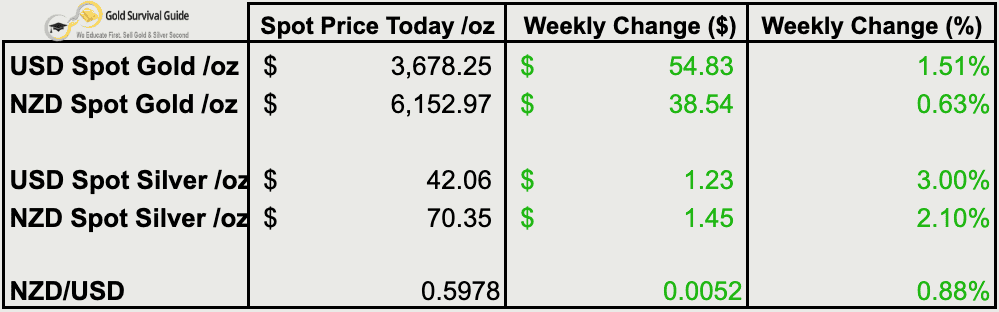
Weekly Price Overview – 17 September 2025
Both gold and silver continued their push higher this week, with silver leading the way in percentage terms. Gold hit more record highs, while silver now sits just below key resistance levels.
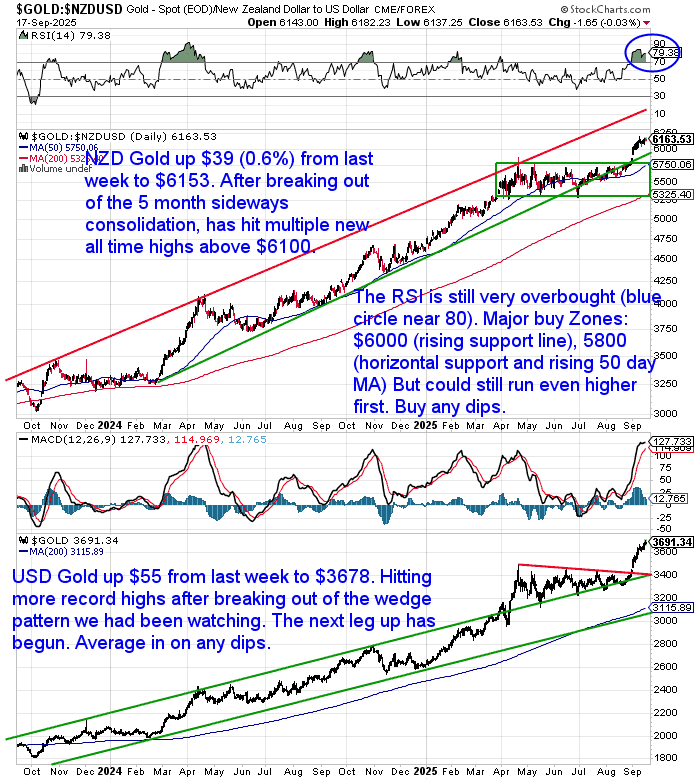
🟡 NZD gold rose $38.54 to $6,152.97 (+0.63%), climbing further above the $6,100 level. USD gold added $54.83 to $3,678.25 (+1.51%), extending its breakout rally and setting another new all-time high.
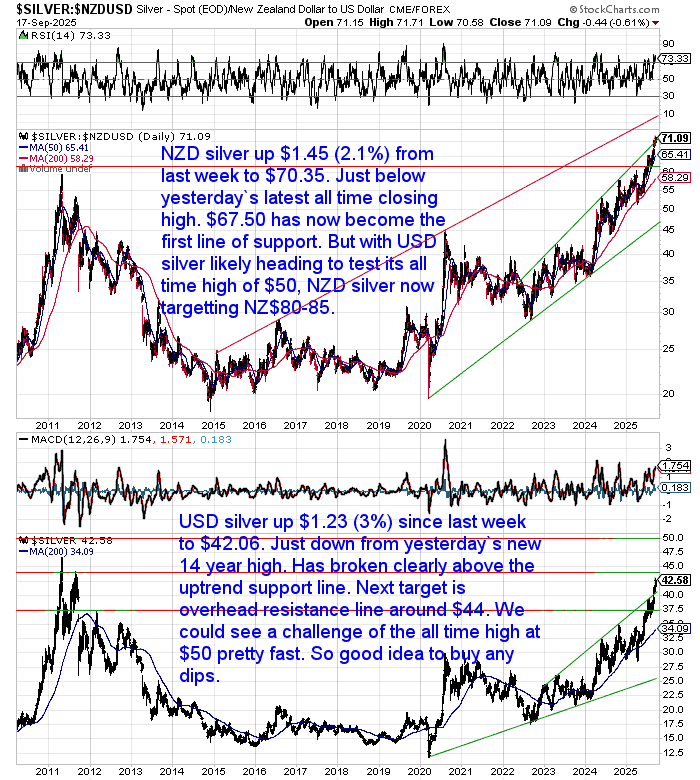
⚪ NZD silver gained $1.45 to $70.35 (+2.10%), continuing its steady rise and closing in on the $72 resistance zone. USD silver jumped $1.23 to $42.06 (+3.00%), pushing to a new 14-year high and eyeing a run toward $44–$50.
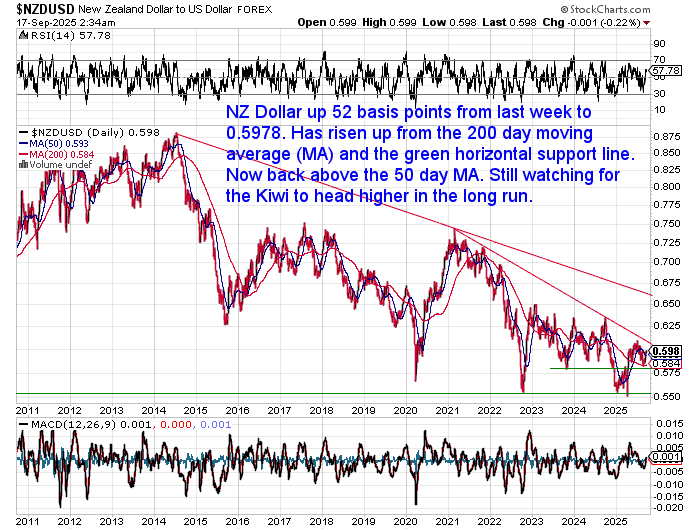
💱 The NZD/USD rose 0.88% to 0.5978, back above the 50-day MA. Strength in the Kiwi capped some local gold gains. Long-term momentum remains upward.
📈 Technicals remain bullish across the board, with silver now accelerating and gold staying strong. As long as silver remains above support, dips still look buyable — especially with momentum building toward retesting all-time highs.
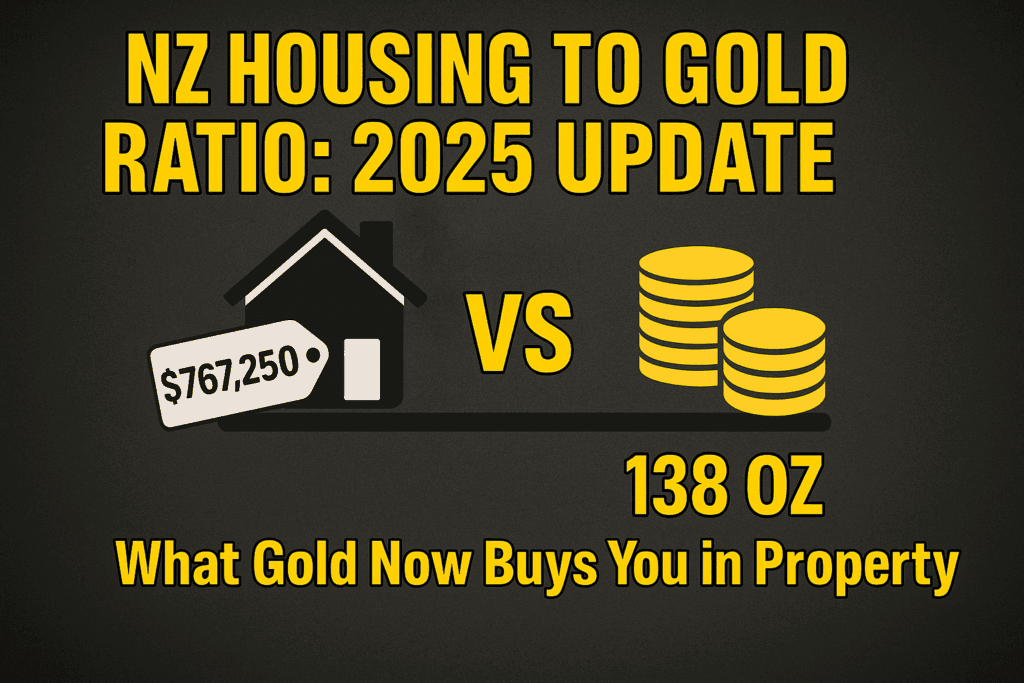
Housing-to-Gold Ratio Hits 1987 Levels — Here’s What That Means
How much gold does it take to buy a house today?
In New Zealand, that number has dropped to just 138 ounces — a level last seen in 1987.
In our latest update, we look at how property compares to gold in NZ, Australia, the US, and the UK.
You’ll also find 4 possible scenarios of where the ratio could go next…
See this week’s chart of the week: NZ Housing-to-Gold Ratio 1962–2025
Is Gold’s Run Only Just Beginning?
Despite hitting all-time highs in every fiat currency, many investors worry that gold and silver have peaked.
But veteran US precious metals dealer Robert Mish (from Mish International Monetary) believes the real move is still ahead.
Why?:
🔸 Sellers still outnumber buyers in his retail store 3 to 1 — even with gold at record highs.
🔸 Large institutional traders are now 84% long gold futures — historically the “smart money”, while retail traders are unusually short (a contrarian signal).
🔸 COMEX silver short positions now exceed 150+ days of mine output — while premiums in Shanghai signal growing demand.
🔸 Central banks now hold the highest % of gold in 30+ years — a silent monetary reset in progress.
Meanwhile, most portfolios are still underexposed. Ray Dalio recommends 10–15% in gold… But how many portfolios are anywhere near that today?
Gold and Rate Cuts
As gold continues to push into record territory, the key question is: how much further could it go?
One clue comes from history.
When the US Federal Reserve begins cutting interest rates — as it appears close to doing again — gold has often surged. The chart below highlights two major rate-cut cycles in the past 20 years:
+118% gain during and after the 2008 rate cuts
+35% during the 2020–2021 rate cut cycle
With markets now pricing in Fed cuts by late 2025, gold may be setting up for another powerful leg higher.
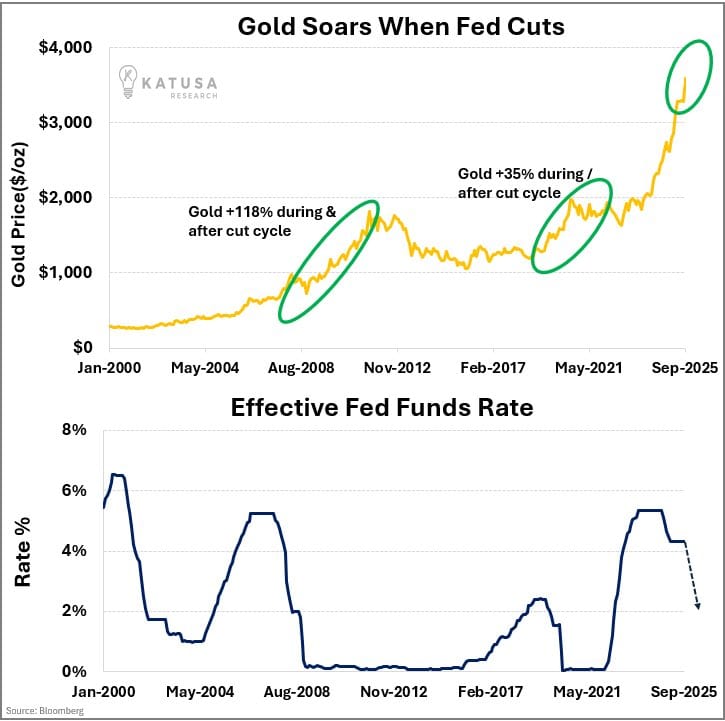
Chart: Katusa Research
Stock Markets: High on Rate Cut Hopes — But Overvalued?
The US central bank is feeling the pressure to ease the USA’s debt burden.
But Elliott Wave Research says the Dow is now more overvalued than at any point in history — including 1929 and 1999.
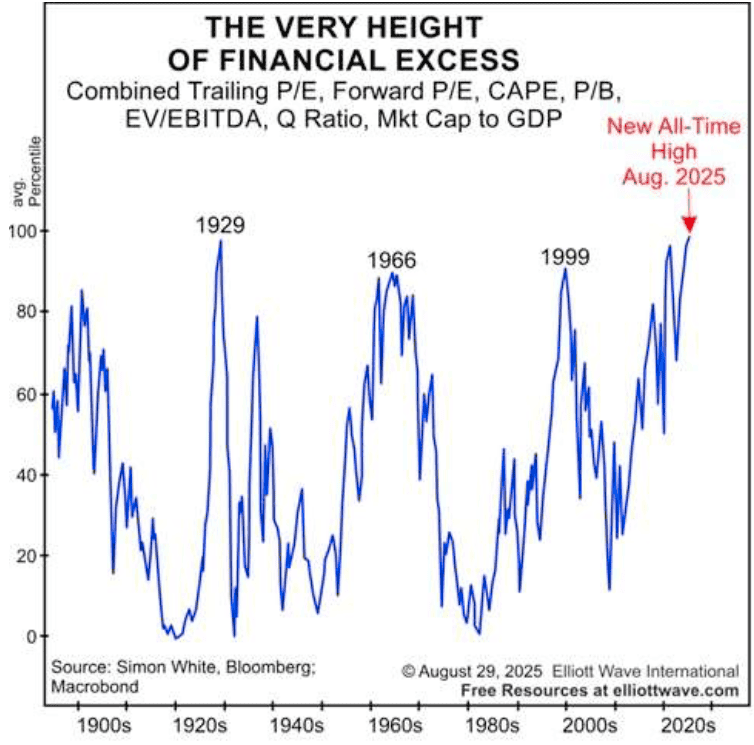
Source: elliottwave.com/
Jesse Colombo warns this could trigger another “dot-com style” bubble — but this time in AI stocks.
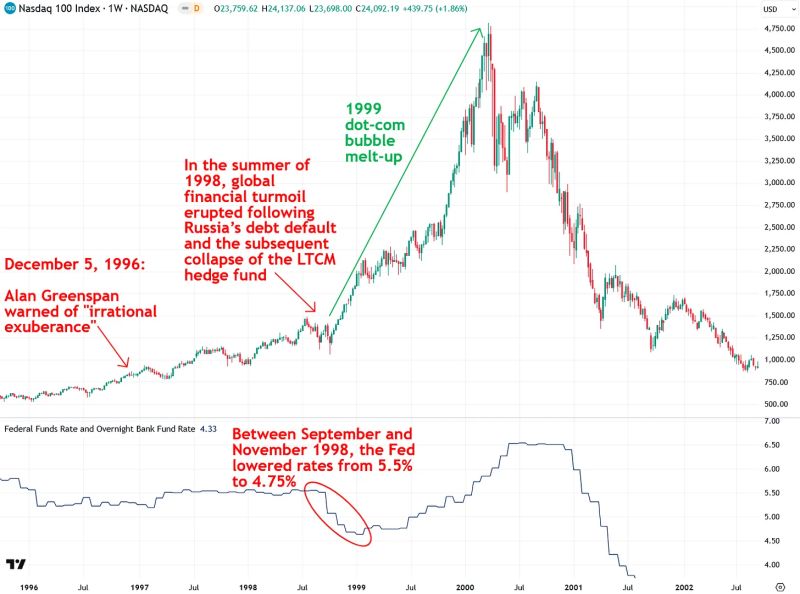
Source: Jesse Columbo
Is Silver’s Rate Cut Setup Even Stronger?
Just as gold tends to surge during Fed easing cycles, silver has a track record of going even further — often delivering triple-digit gains.
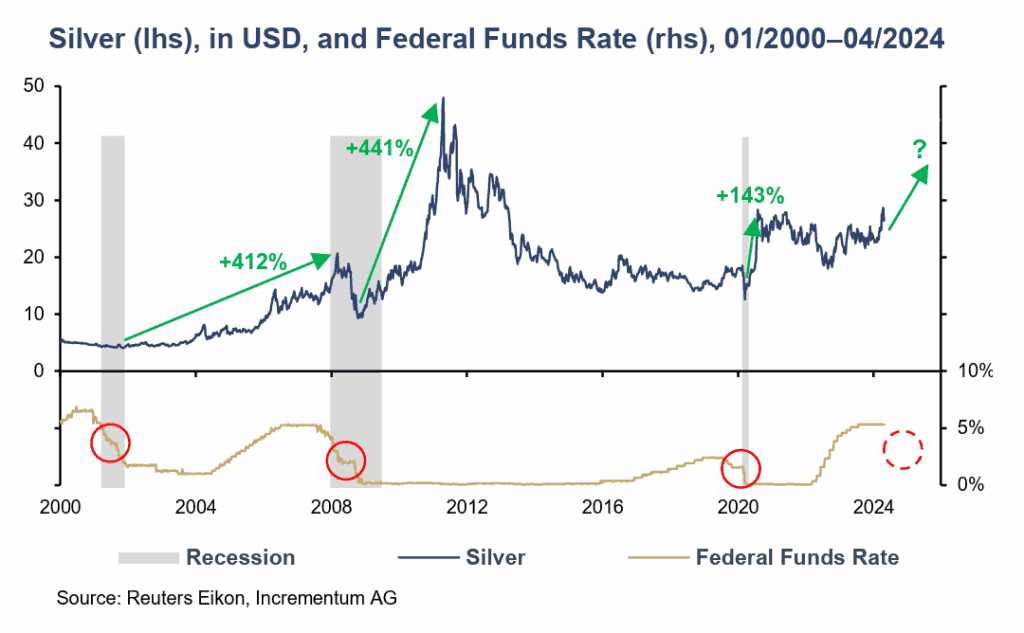
Source: Sound Money Report
Now with:
- Global deficits building
- Rising industrial demand
- And retail investors still underexposed…
…the case for silver looks compelling.
Tavi Costa adds:
“The outperformance of hard assets over financial assets may be one of the most important macro trends of the decade.”
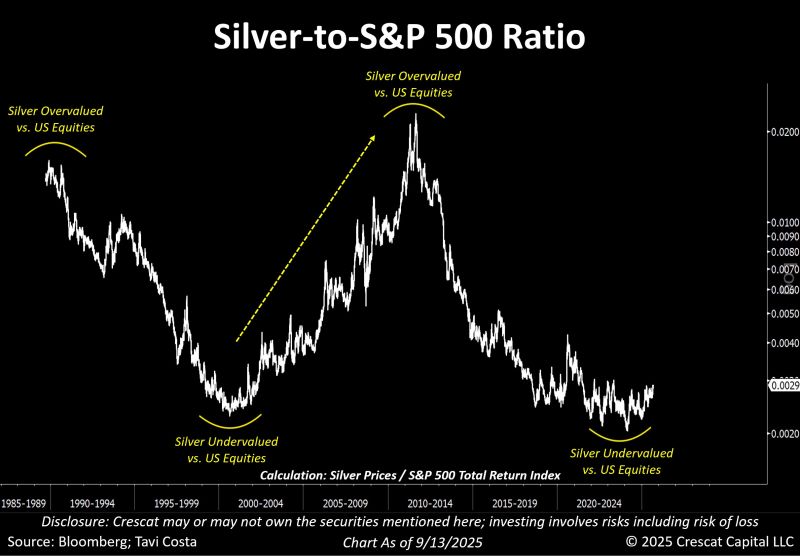
Source: Tavi Costa
Especially when you consider this chart from Porter Stansberry:
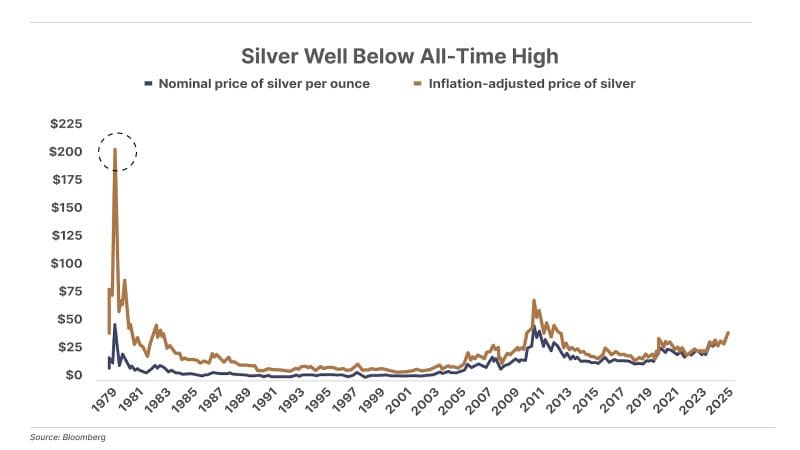
Silver remains far below its 1980 inflation-adjusted high — needing to rise above $200/oz just to catch up.
While central banks quietly accumulate gold, silver continues to be ignored by most.
That’s the kind of off-the-radar opportunity that rarely stays quiet for long.
Gold is at record highs. Silver hasn’t even caught up to its 1980 value — let alone its inflation-adjusted peak.
We believe this is still just the beginning.
So the only question is:
How’s your portfolio positioned?