Table of contents
Estimated reading time: 6 minutes
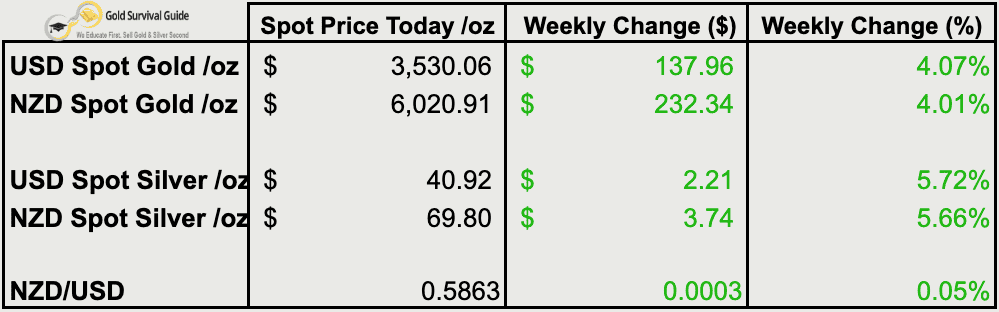
Weekly Price Overview – 3 September 2025
Gold and silver surged this week, with silver leading. USD and NZD gold hit records, as did NZD silver. USD silver looks set to challenge $50..
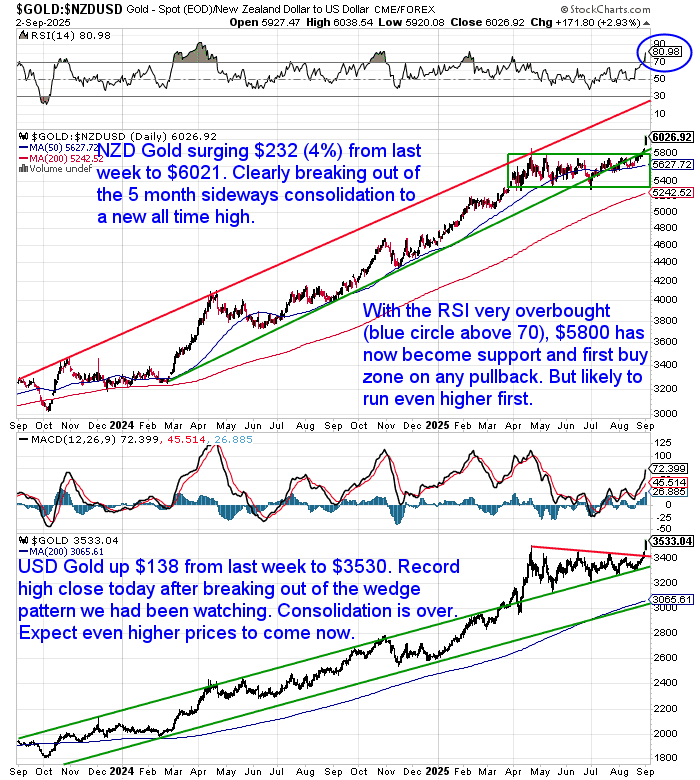
🟡 NZD gold jumped $232 to $6,020.91 (+4.01%), breaking decisively out of its five-month consolidation to a new all-time high. USD gold climbed $138 to $3,530.06 (+4.07%), with the breakout suggesting more upside to come.
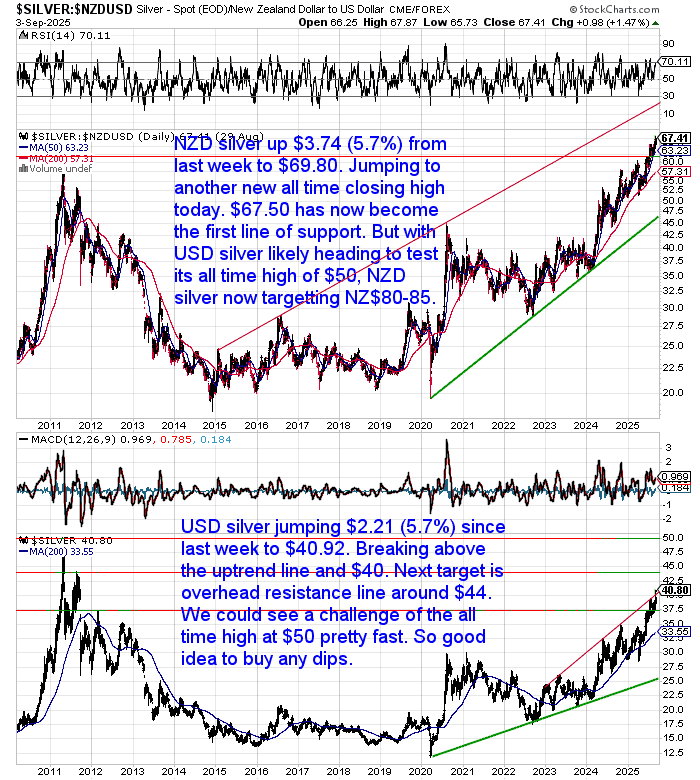
⚪ NZD silver rose $3.74 to $69.80 (+5.66%), also hitting another record closing high. USD silver gained $2.21 to $40.92 (+5.72%), clearing key resistance at $40 and now eyeing $44, with $50 in sight.
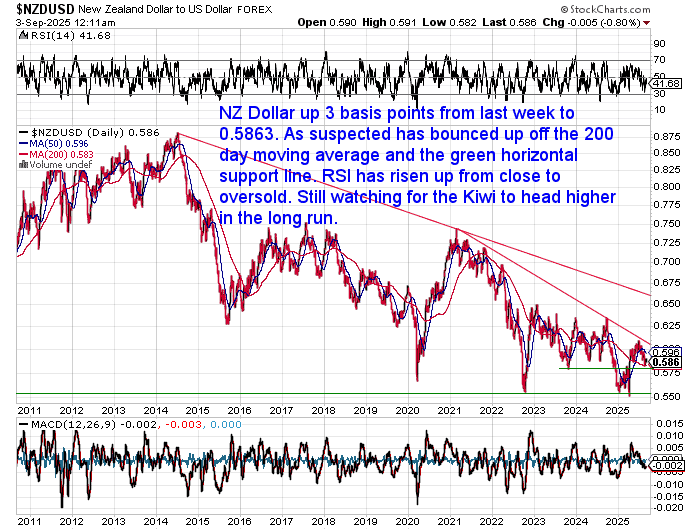
💱 The NZD/USD added just 0.05% to 0.5863, bouncing from support but still in a broader downtrend. Local pricing remains well supported by a weaker Kiwi.
📈 Technicals point to strong bullish momentum in both metals. With gold breaking higher and silver pushing toward historic USD highs, dips continue to look like buying opportunities — particularly in silver.
Where Are We in the Silver Market Cycle in 2025?
Silver hit a record NZD $67/oz, yet global demand has fallen back to 2016 levels — hardly the sign of a mania.
So where exactly are we in the cycle today? Hope? Optimism? Or even early enthusiasm?
In this week’s feature we compare:
- The classic Wall Street Cheat Sheet cycle
- The classic Wall Street Cheat Sheet cycle
- Our latest NZD and USD silver psychology charts

Gold Hits New All-Time Highs, Analysts Stay Bearish
For the first time ever, gold crossed USD $3,500/oz. As Dean Chrastina noted, that’s exactly 100x the fixed price of $35 from 1934–71 — a compounded gain of 8.9% per year for 54 years, outpacing even the S&P 500’s 8.1%.
Bank of America now sees gold at $4,000 by 2026 — up sharply from its $3,063 call in March.
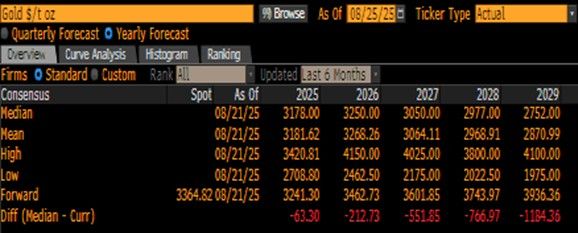
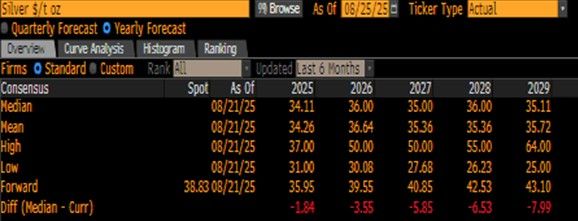
Meanwhile, Bloomberg’s consensus forecasts still point lower — with median targets for gold dropping to $2,752 by 2029 and silver sliding back below $35.
Gold 5 year forecasts. Source: Ronni Stoeferle
Silver 5 year forecasts. Source: Ronni Stoeferle
Our contrarian insight: At bull market peaks analysts get euphoric. Today they’re skeptical — a sign this run still has fuel.
Institutions and Central Banks Keep Buying
Comex data tells the story: 2025 gold and silver deliveries have already topped all of 2024 — by September 1st.
That’s 100oz gold bars worth $350k each, and 5,000oz silver bars worth $200k.
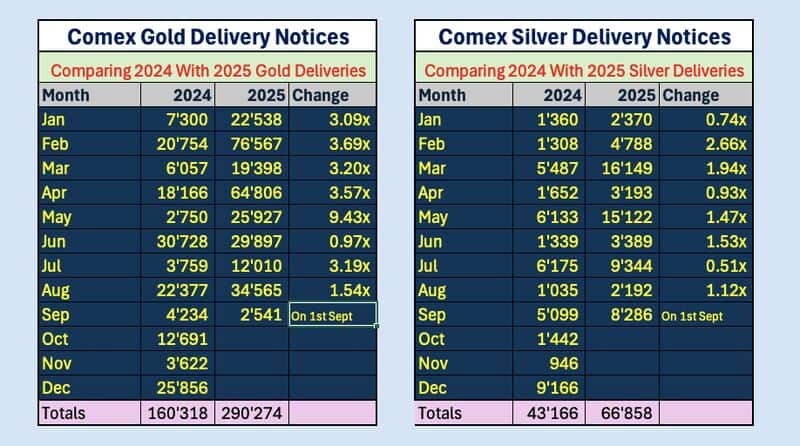
Source: Clive Thomson
This isn’t retail buying — it’s big money accumulating.
Globally, central banks continue to pile into gold. As Tavi Costa points out, foreign central banks now hold more gold than U.S. Treasuries for the first time since 1996.
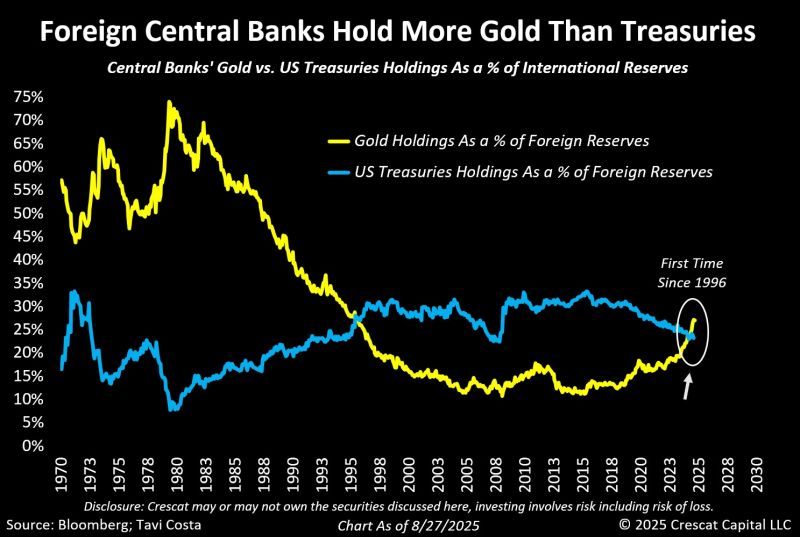
Source: Tavi Costa
Chart of the Week: Global Reserves Shift
Jan Nieuwenhuijs chart highlights that gold’s share of total international reserves is back to 24%, its highest since the mid 1990s. The USD still dominates at 44%, followed by the euro at 15%.
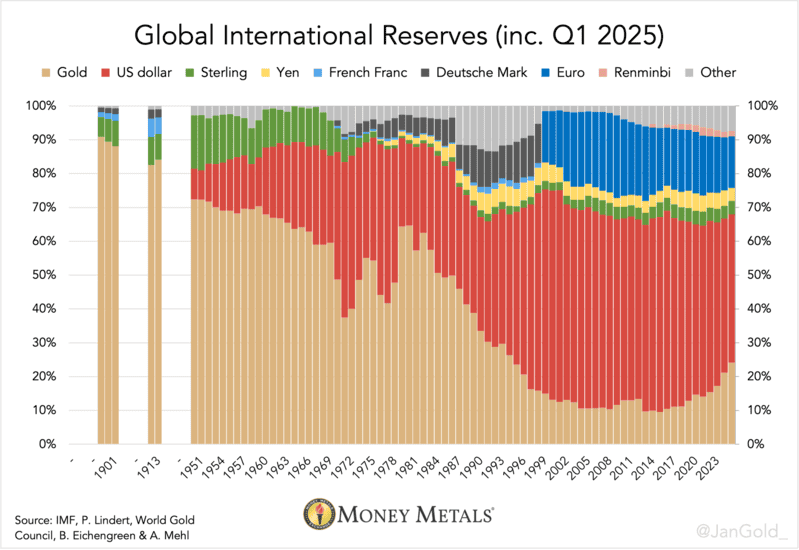
Source: Jan Nieuwenhuijs
But while gold is climbing in importance, we’re still a long way from the 60% share it commanded in 1979–80.
Meme of the Week: “I wish I bought gold and silver earlier…”
Today’s weak retail buying suggests most investors are still sitting on the ‘regret’ side of the stool.
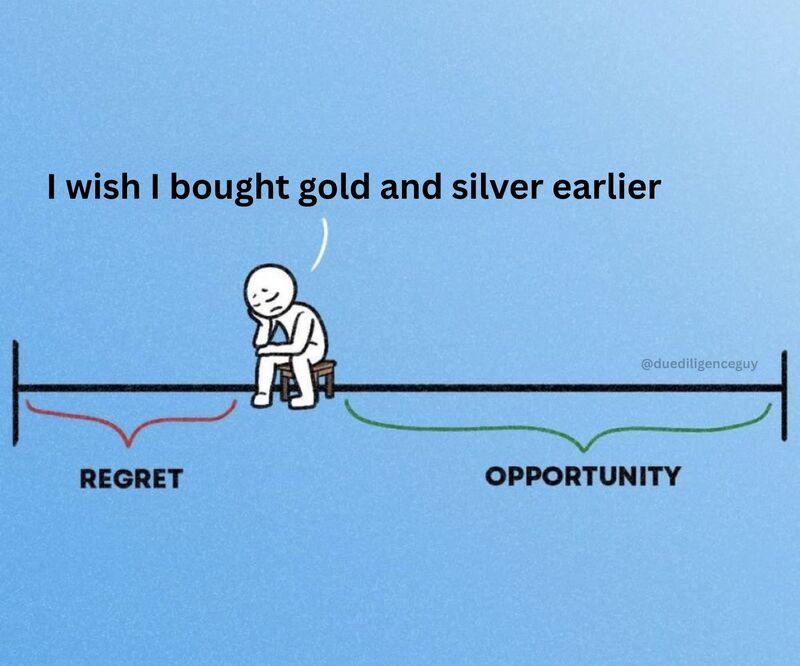
Lobo Tiggre put it well when he asked:
“What do you think? Is this where we are? Or closer to the left? Or right?”
When we combine this with our Silver Market Cycle 2025 feature, plus the analyst forecasts and institutional buying trends we covered above, the evidence leans toward us still early in the opportunity side of the spectrum.
The crowd hasn’t arrived yet. Which means the window for smart money is still open.
We see years left in this bull market. Silver, especially, has plenty of catching up to do.