
This Week:
- World Gold Council Agrees on 3 Gold Myths
- RBNZ: Warning of a problem they caused
- Announcements Due: China Gold Reserves and SDR Inclusion
Prices and Charts
| Spot Price Today / oz | Weekly Change ($) | Weekly Change (%) | |
|---|---|---|---|
| NZD Gold | $1620.00 | + $44.66 | + 2.83% |
| USD Gold | $1205.28 | + $9.12 | + 0.76% |
| NZD Silver | $22.85 | + $0.46 | + 2.05% |
| USD Silver | $17.00 | $0.00 | 0.00% |
| NZD/USD | 0.7440 | – 0.0153 | – 2.01% |
A change of trend from last weeks newsletter.
The US dollar prices of gold and silver were fairly flat compared to last week but the weaker NZ dollar meant strong rises for gold and silver in NZ dollars.
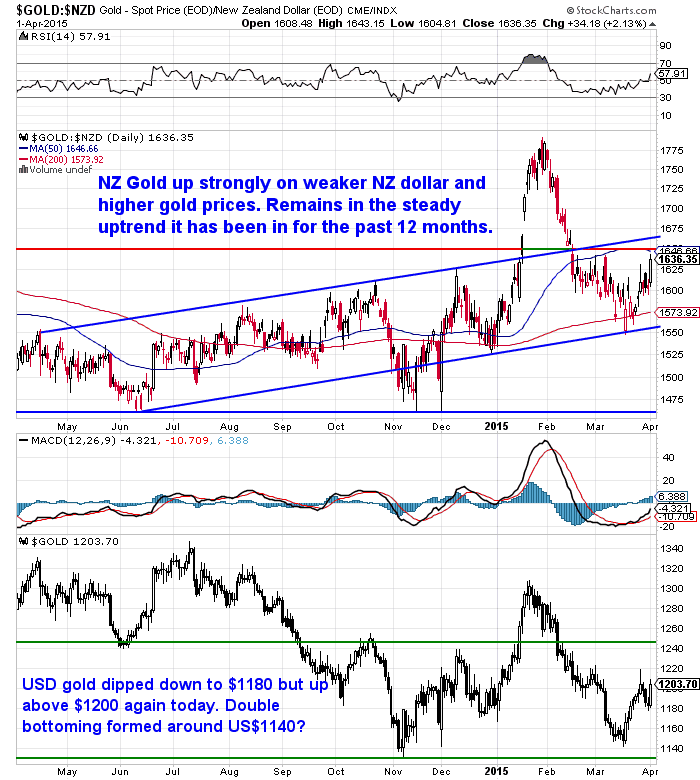
NZD gold continues to rise slowly but steadily in the uptrend it has been in for the past 12 months. While USD gold is still trading in a sideways pattern.
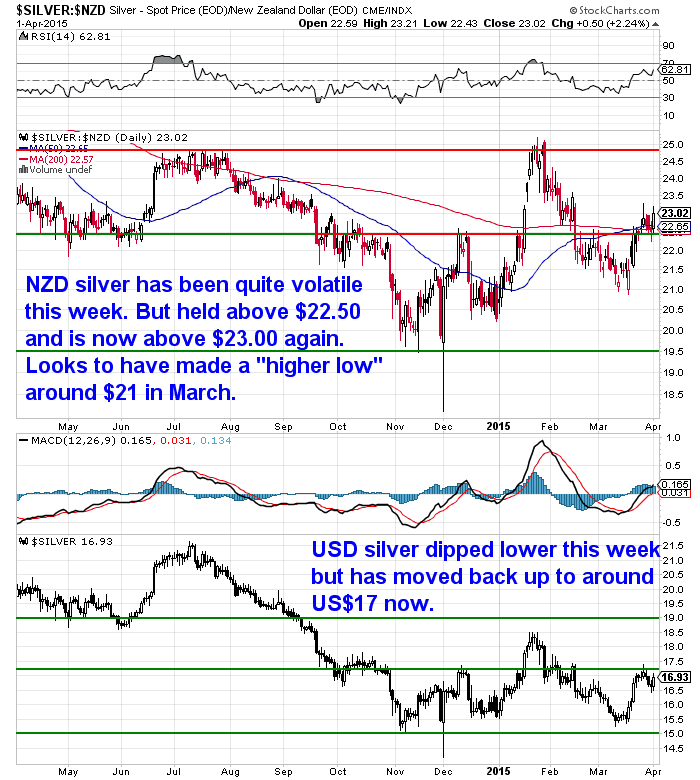
NZD silver also looks to have made a “higher low” around $21 in March. Silver has been trending higher since November and has surprisingly outpaced gold since the start of the year.
So why is gold rising?
Perhaps because people expected it to fall.
Zerohedge reported how:
“net long positions in Gold have dropped to their lowest since Dec 2013 and outright Gold short positions rose for the seventh week in a row to the highest since data began in 2006.”
Their chart shows that overall gold shorts have never been higher…
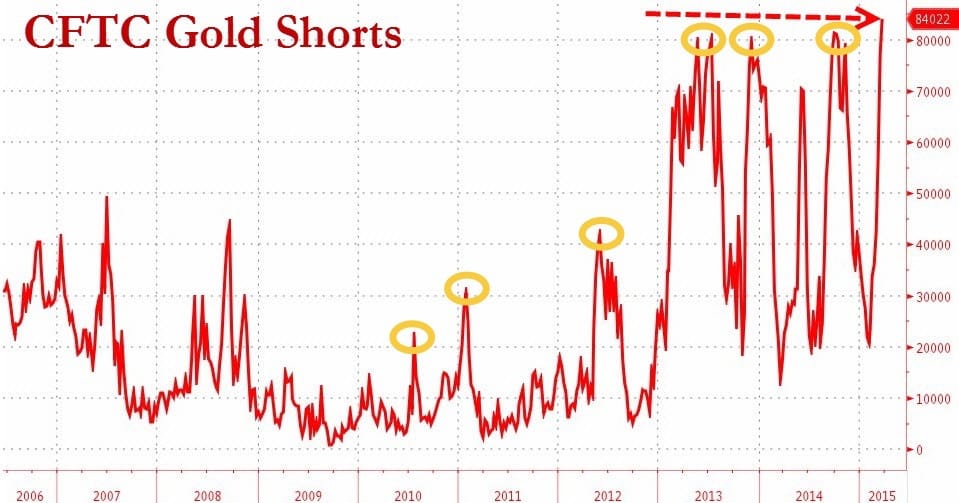
So gold short positions are at extreme highs – but what does this mean?
Well, we quickly threw a chart together looking back at a gold chart over a similar period.
Turns out, past extreme highs in short positions all saw the price of gold bounce quite sharply higher over the next few months, if not longer…
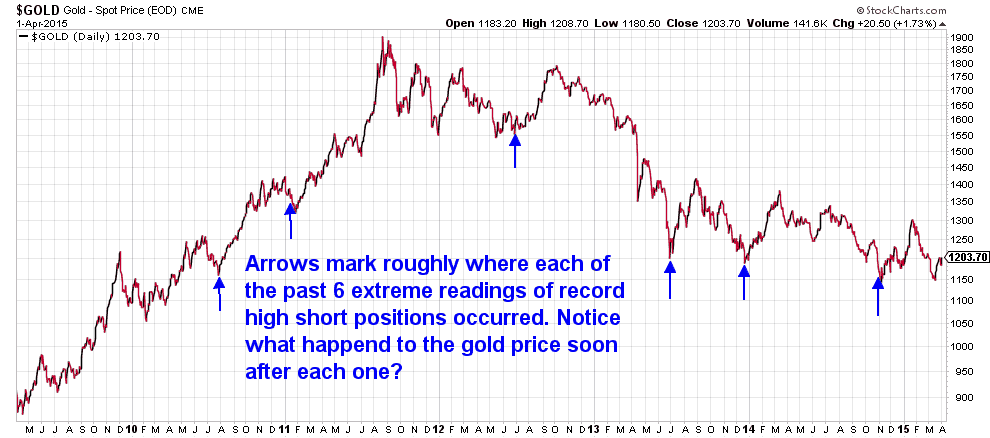
So could be a decent move higher coming if past extremes are any guide. This would fit in nicely with the US dollar also dropping lower from here. Given how many people expect it to keep rising from here, we won’t be surprised to see the USD fall for a spell.
World Gold Council Agrees on 3 Gold Myths
Last week we discussed 3 gold myths:
- Gold and interest rates
- Gold and Inflation
- Gold and the US dollars inverse relationship
Coincidentally the day after we did this the World Gold Council (WGC) published some research on these topics too. While many like Koos Jansen have railed against the WGC’s numbers when it comes to gold demand in China, and while many also refer to them as being part of the “Dark Side”, we still keep an eye on their reports as there is often a gem or 2 of information in them.
A quick synopsis of the report:
“Gold in a rising dollar environment
Generally, there is an inverse correlation between gold and the dollar. However, our analysis shows it is asymmetrical: the gold price increases more when the dollar weakens, than it falls when the dollar strengthens. In our view, the dollar’s relationship with gold has changed dramatically over the past decades and is likely to shift further as demand moves East and the world moves to a multicurrency system.
Interconnections: the factors that drive gold
We present a useful framework to help investors understand gold’s performance.
The market may be wrong about gold and US interest rates
Many investors believe that higher US interest rates will be certainly bad for gold. Our analysis shows that other factors – some positively correlated to the economic growth that often accompanies rising rates – can have more influence on the gold price. We also highlight gold’s portfolio benefits at a time when stocks and bonds may deliver lower-than-average returns in coming years.”
You need to register (for free) to read the full report but there is a decent infographic on the page where you don’t.
RBNZ: Warning of a problem they caused
Very amusing this.
Just as we hit send last week, the RBNZ released a report warning of the rising private debt levels in New Zealand. Private debt is edging steadily closer to the 2008 peak of 175% of disposable income (164% as of Sept 2014).
They discuss the causes and even name very low interest rates as one of them.
“Since late 2011, however, rising house prices, easing credit conditions (including an increase in lending at high loan-to-value ratios during 2012-13) and low interest rates have contributed to a pick-up in the growth rate of household debt (albeit to a rate much lower than the average during the last financial cycle). “
But not surprisingly, no mention that they (the RBNZ) are to blame for these anyway in the report!
So they are warning of higher private debt levels, which are caused by easy credit conditions and low interest rates – both controlled by the RBNZ.
How?
In the form of lending rules that specifically allow banks to lend more against residential property and in the form of the Overnight Cash Rate (OCR) being kept historically low.
To be honest the report doesn’t contain any particularly startling information. There’s some charts showing NZ housing is overvalued on Price to Rent and Price to Income basis.
But we just find it very amusing that the RBNZ can warn of problems it is playing a large part in creating, do it with a straight face, and have no one pull them up on it!
Meanwhile the government has put in place its election bribe “Homestart” subsidy for first home buyers to encourage some more young people to get massively into debt.
Gee – wonder what that will do to house prices?
Odds are the RBNZ’s “warning” on private debt will prove correct at some stage. It’s not quite 2007 all over again but we seem to be steadily getting up there.
China Gold Reserves and SDR Inclusion
We’ve read many a prediction on when China will next announce its true gold reserves.
Some have been and gone, some still to come.
The National Inflation Association (NIA) believes 2015 is the year and maybe even in the next month.
“As of next month it will be exactly six years since China last reported its official gold reserves in April 2009, when it disclosed a gold reserve of 1,054 metric tons. NIA believes there is a 90% chance that China will announce its latest gold reserves this year – and a 50% chance of it being within the next 60 days. When China reported a gold reserve of 1,054 metric tons in April 2009, it was exactly six years since they announced their previous gold reserve update in April 2003. In April 2003, China reported a gold reserve of 600 metric tons. China accumulated 454 metric tons over the following six years to increase their gold reserve by 75.67%!
NIA believes that China has been aggressively accumulating a massive reserve of gold, with a goal of positioning the RMB to replace the USD as the world’s reserve currency. Because China has such large US Dollar reserves, it must shift its USD holdings into gold in secret. Once the public becomes aware of just how large China’s gold reserves have become, we will see a worldwide run on the dollar and rush into gold.
For China to reach gold reserves worth a healthy 10% of its FOREX reserves to strongly position the RMB to replace the USD as the world’s new reserve currency, China would need to increase its gold reserves by 844.3% to 9,953 metric tons. Based on gold’s average price over the last six years of $1,365 per oz, this would have cost China an estimated $390.54 billion. A cost of $390.54 billion is equal to just 31.4% of the $1.243 trillion in US Dollars that China needed to invest outside of US Treasuries. If China has increased its gold reserves to 9,953 metric tons, it would now have the world’s largest gold reserve, surpassing America’s purported gold reserve of 8,133.5 metric tons!”
They go into quite some detail as to how China’s holdings of US treasuries have altered over the past 9 years and they make some decent educated guesses as to how much of this might have gone into gold. It’s worth clicking through to read the whole piece and see their charts:
http://inflation.us/chinas-
NIA makes the argument that China and Russia are working together to dethrone the USD as the worlds reserve currency. It certainly looks that way.
However another angle and one we favour is that this might all be a game on the surface.
If you’ve ever read the Creature from Jekyll Island you’ll know how the money masters have been behind just about every war in the past century or more. Often financing both sides, so they win whatever the result. Even some you’d not expect like playing both sides in the Russian Bolshevik Revolution.
So this other argument is that there is not a “war” between the USA and China/Russia. But rather they are all part of a steady movement to a global currency using the IMF’s Special Drawing Rights (SDR).
An article we read this week does an excellent job of explaining the changes that are coming up in the next 10 months in the international monetary system in particular in regards to the SDR. It also backs up the NIA timeline with regards to China announcing their gold reserves.
THE SDR which is currently made up of USD 44%, EURO 34% GBP 11%, and YEN 11% – is adjusted every 5 years.
The makeup of SDR basket will once again be adjusted on 1 January 2016. There will be a meeting to review the weights in May 2015. This will be confirmed in October, 2015.
You may well have read recent reports of this too with publicity around meetings between the IMF’s Christine Lagarde and Chinese Premier Li Keqiang:
So the timeline seems to be on track. The article above also theorised that it’s possible gold may be included into the SDR basket. Even if it’s not, a Chinese announcement of their increased gold reserves would add weight to the argument for the Yuan being included in the SDR.
There are certainly a lot of changes due to come this year in the global monetary system.
Make sure you have a hedge in place before these take place. As we could see some even more serious volatility in exchange rates this year when they do.
Free delivery anywhere in New Zealand and Australia
We’ve still got free delivery on boxes of 500 x 1oz Canadian Silver Maples delivered to your door via UPS, fully insured.
Todays price is $13,730 and delivery is now about 7-10 business days.
This Weeks Articles:
 |
|
 |
|
 |
|
As always we are happy to answer any questions you have about buying gold or silver. In fact, we encourage them, as it often gives us something to write about. So if you have any get in touch.
|
| Today’s Spot Prices Spot Gold |
|
| NZ $ 1620 / oz | US $ 1205.28 / oz |
| Spot Silver | |
| NZ $ 22.85 / oz NZ $ 734.61 / kg |
US $ 17.00 / oz US $ 546.55 / kg |
| 7 Reasons to Buy Gold & Silver via GoldSurvivalGuide Today’s Prices to Buy |
|
1oz NZ 99.99% pure gold bar
 $1675.08 |
|
1kg NZ 99.9% pure silver bar
 $808.07 (price is per kilo for orders of 1-4 kgs) $799.83 (price is per kilo only for orders of 5 kgs or more) |
|
|
|
1oz PAMP Suisse 99.99% pure gold bar
 $1721.70 |
|
1kg PAMP 99.9% pure silver bar
 $858.07 |
|
1oz Canadian Gold Maple 99.99% pure gold coin
  $1741.50 |
|
1oz Canadian Silver Maple 99.99% pure silver coin (Minimum order size tube of 25 coins)
  Tube of 25 $737 Box of 500 $13730 (Fully insured and delivered) |
|
|
Note:
|
| Can’t Get Enough of Gold Survival Guide? If once a week isn’t enough sign up to get daily price alerts every weekday around 9am Click here for more info |
Our Mission
|
| We look forward to hearing from you soon.Happy Easter Holidays and have a golden weekend!Glenn (and David) GoldSurvivalGuide.co.nz Ph: 0800 888 465 From outside NZ: +64 9 281 3898 email: orders@goldsurvivalguide.co.nz |
 |
 |
| The Legal stuff – Disclaimer: We are not financial advisors, accountants or lawyers. Any information we provide is not intended as investment or financial advice. It is merely information based upon our own experiences. The information we discuss is of a general nature and should merely be used as a place to start your own research and you definitely should conduct your own due diligence. You should seek professional investment or financial advice before making any decisions. |
| Copyright © 2013 Gold Survival Guide. All Rights Reserved. |
Pingback: Silver and the US Dollar: Will History Rhyme? - Gold Prices | Gold Investing Guide
Pingback: China Joins the SDR Big Boys Club. What's the Significance? - Gold Survival Guide