Weekly Market Wrap – 25 June 2025
This Week:
- Weekly Market Wrap – 25 June 2025
- Weekly Price Overview – 25 June 2025
- Strong NZD? What It Means for Gold & Silver in NZ
- Gold & the Middle East: Why Didn’t It Spike?
- Gold’s 31-Year Cycle: Where Are We Now?
- Gold Coverage Ratio: Why $13,000 Isn’t Crazy
- Silver Breakout Charts You Shouldn’t Miss
- Could Silver Really Go 27x? Here’s the Money Supply Data
Estimated reading time: 5 minutes
Weekly Price Overview – 25 June 2025
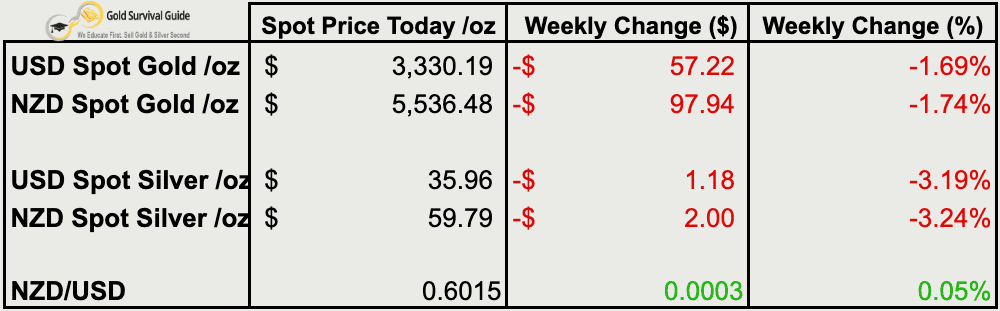
Gold and silver pulled back this week, offering dip-buying opportunities, as the NZD edged higher.
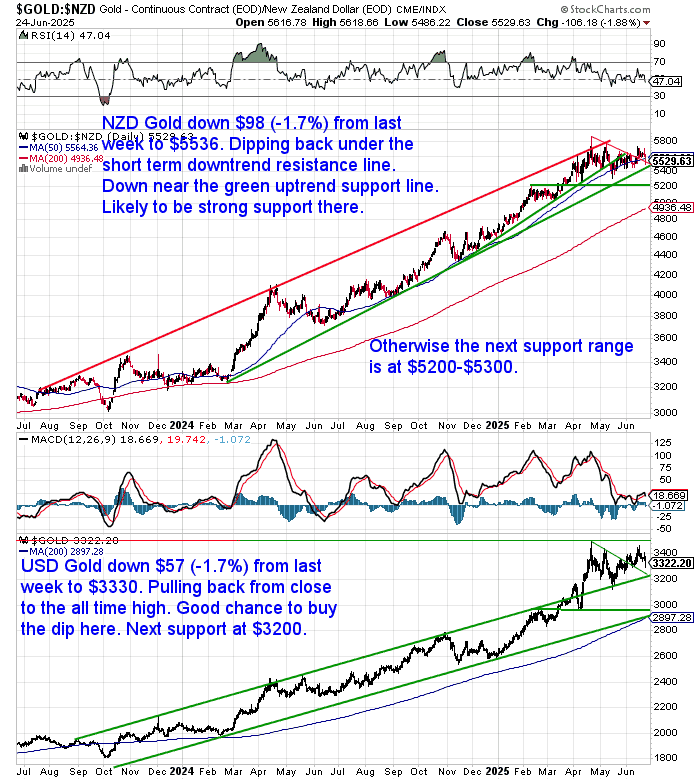
🟡 NZD gold dropped $98 to $5,536.48 (-1.74%), slipping just below short-term resistance but sitting on longer-term support. USD gold fell $57 to $3,330.19 (-1.69%), dipping from near all-time highs. The $3,200 level remains key support.
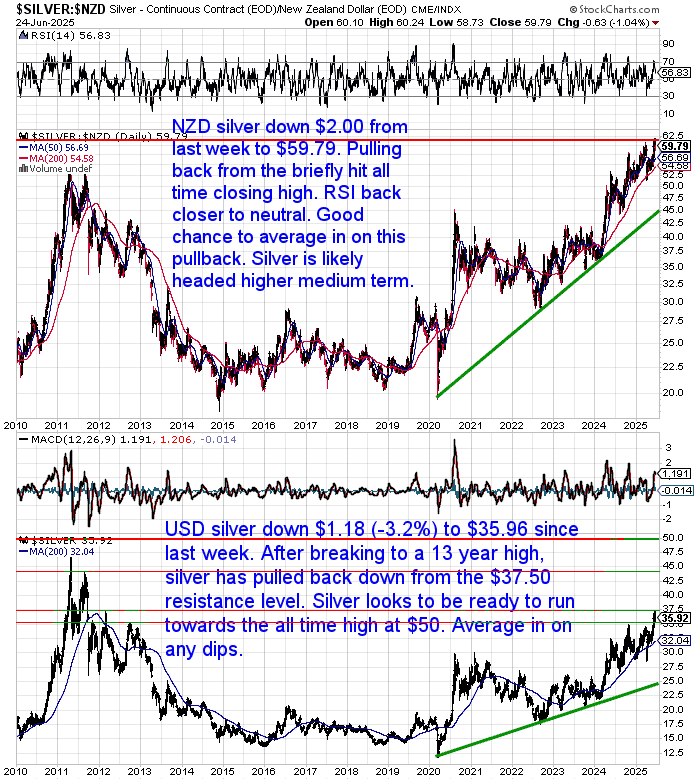
⚪ Silver also corrected. NZD silver fell $2.00 to $59.79 (-3.24%), easing off its all-time high. A healthy pullback that brings the RSI closer to neutral. USD silver declined $1.18 to $35.96 (-3.19%), just under strong resistance at $37.50.
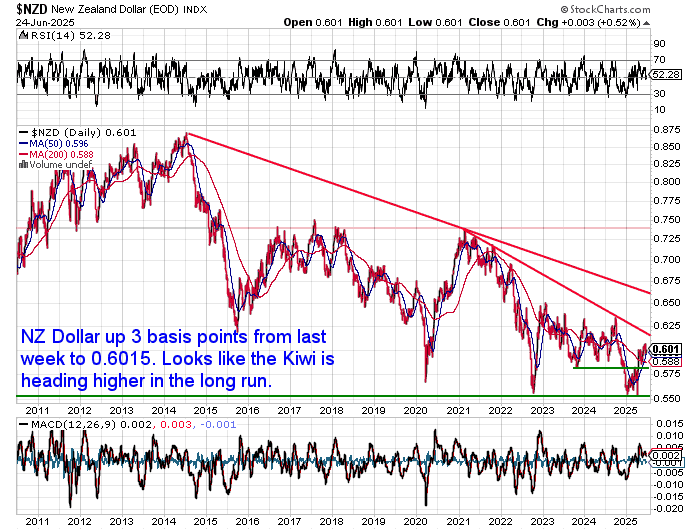
💱 The NZD rose to 0.6015 (+0.05%), breaking above a long-term trendline and signalling medium-term strength — something to watch for its impact on NZ metals pricing. See this week’s feature article for the full run down on this topic.
📈 Technicals show gold is near key support, while silver’s trend remains intact despite this week’s retreat. Price dips in both metals offer attractive entry points, especially for silver buyers watching the long-term breakout in play.
Strong NZD? What It Means for Gold & Silver in NZ
The NZ dollar has surged in 2025 — but what does that mean for gold and silver prices here in NZ?
We’ve just updated our deep-dive guide with fresh charts comparing local vs global bullion prices, and tips on what to do when the Kiwi is strong. Read the full update here.
Gold & the Middle East: Why Didn’t It Spike?
History shows that war often causes only short-lived moves in gold. While geopolitical risk can influence the metal longer term, initial spikes are usually brief. (For more see last week’s article: How Does War Affect the Gold and Silver Price?)
Also, gold was already in a correction — and this conflict may have simply paused that trend rather than reversing it.
Many people are also wondering why oil didn’t spike even higher.
Last week’s brief clash between Israel and Iran surprised many for how quickly it de-escalated. Ross Norman of Metals Daily called it “geopolitical theatre” — suggesting each side played its part, exchanged carefully managed strikes, and then walked away claiming victory. Oil kept flowing. Markets barely flinched.
Perhaps the market sensed from the start that it wouldn’t escalate. That doesn’t mean tensions are over — but it may explain the muted reaction.
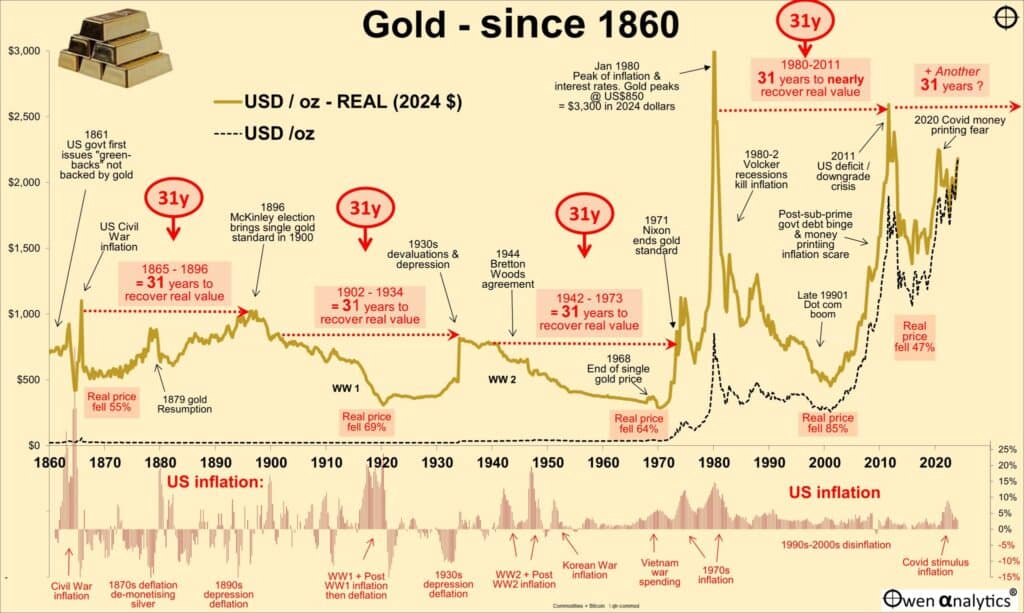
Gold’s 31-Year Cycle: Where Are We Now?
Rather than guessing war’s effect on gold, it’s better to view gold within its long-term cycle. Where loss of trust means gold is returning to the forefront.
This chart of gold since 1860 shows that gold seems to follow a 31 year cycle. If that proves to be the case we are still well over a decade from the end of it.
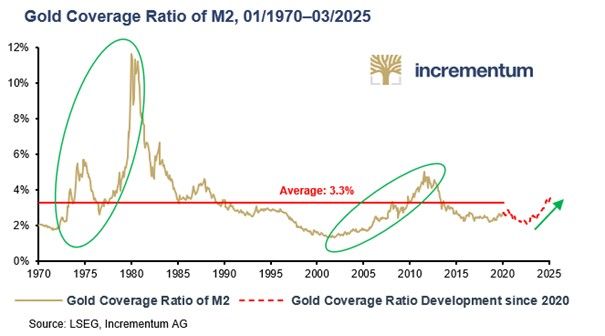
Gold Coverage Ratio: Why $13,000 Isn’t Crazy
The gold coverage ratio shows how much of the currency supply is backed by central bank gold at current prices.
The 2011 spike — following the 2008 crisis — looks much like the mid-1970s surge. If the pattern repeats, we may be entering a move similar to gold’s run into 1980, when the ratio peaked at 12%.
Today, it’s just over 3%. To reach 12%, gold would need to rise nearly 4x — and that’s assuming no further growth in currency supply, which seems unlikely.
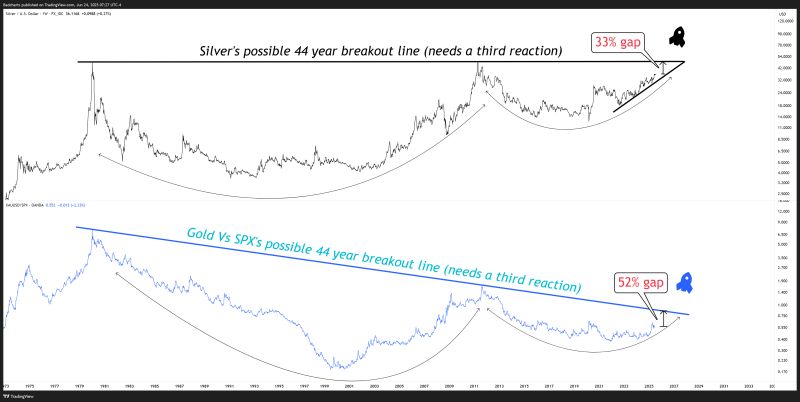
Silver Breakout Charts You Shouldn’t Miss
Silver’s just warming up — to reach breakout:
“Silver would need to rally 33% from current levels to retest its potential historical breakout line around $48.
If that happens in sync, gold could also outperform the stock market by 52% — reaching its own breakout level on the gold vs. stocks ratio chart.”
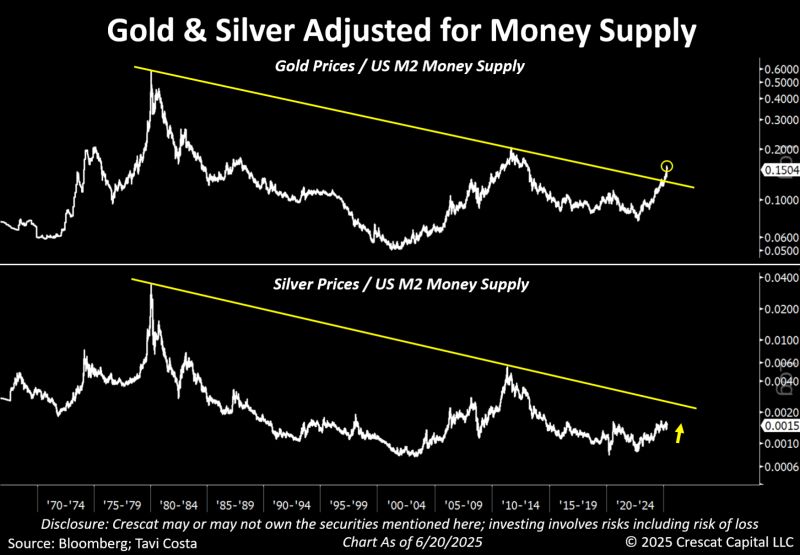
Could Silver Really Go 27x? Here’s the Money Supply Data
The 2 earlier charts show gold has plenty of upside left yet. However that is nothing compared to silver.
Tavi Costa: “Following the historic breakout in gold prices when adjusted for money supply, silver now appears to be setting up for a similar move, in my view.“
To match the 1980 peak, silver needs to rise almost 27 times.
📞 Talk to us today or learn more about how to buy gold – and especially silver – before the next leg up really gets going.