Both metals have continued their falls this week
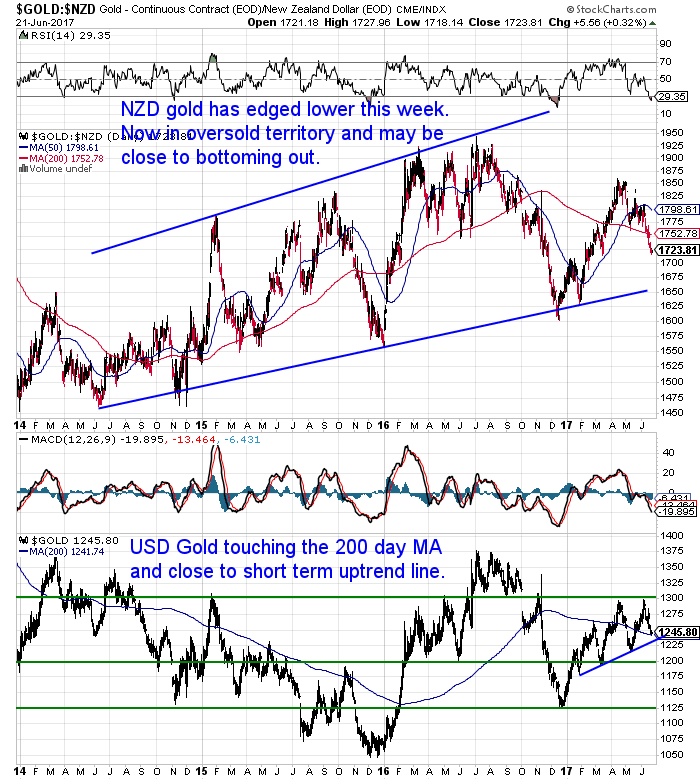
Gold in NZ Dollars dropped just under 1%. It is now well below the 200 day moving average, but still well above the uptrend line from 2014.
The RSI indicator (top of the chart below) is now into oversold territory – a reading below 30.
So we could be pretty close to seeing NZD gold move higher again.
If we also cast our eye over the USD gold chart (the lower part of the chart), this is also close to touching the short term uptrend line. So may be close to moving higher again.
The NZ Dollar may also play its part given how much it has risen of late. More on that soon.
Silver is Struggling
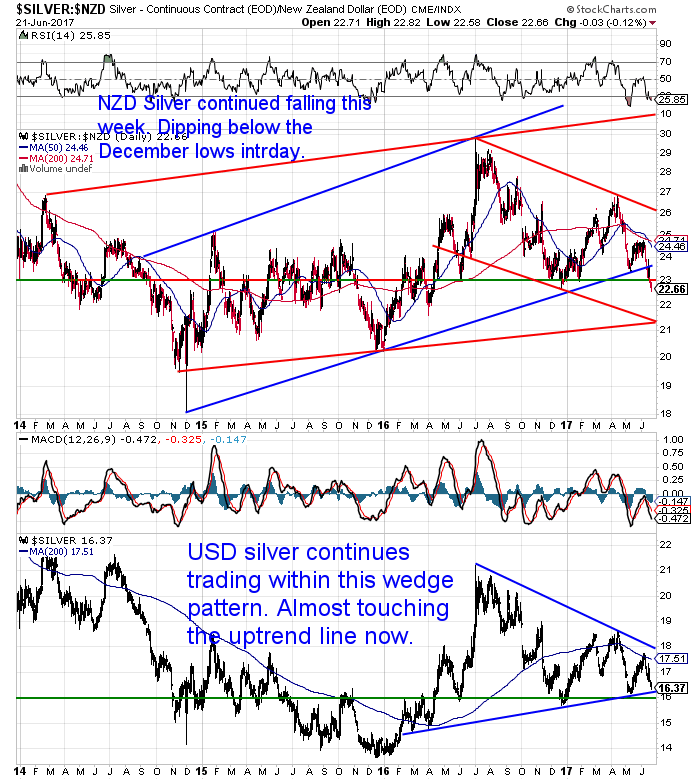
NZD silver has fallen almost 2.5% this past week. It has now clearly dropped below the blue uptrend line from 2014. Intraday today NZD silver also dipped below the lows from December.
So we’ve added some further trend lines in red to the chart below. These show that NZD silver could yet drop down close to the $21 mark. $21 is where the short term downtrend line and the new longer term uptrend line meet.
However NZD silver is also oversold on the RSI indicator.
USD silver (lower half of the chart) is close to touching the uptrend line, so may well bounce from here. This combined with the fact the the NZ Dollar is still ripe for a correction could mean we see a bounce higher in NZD silver very soon. See below.
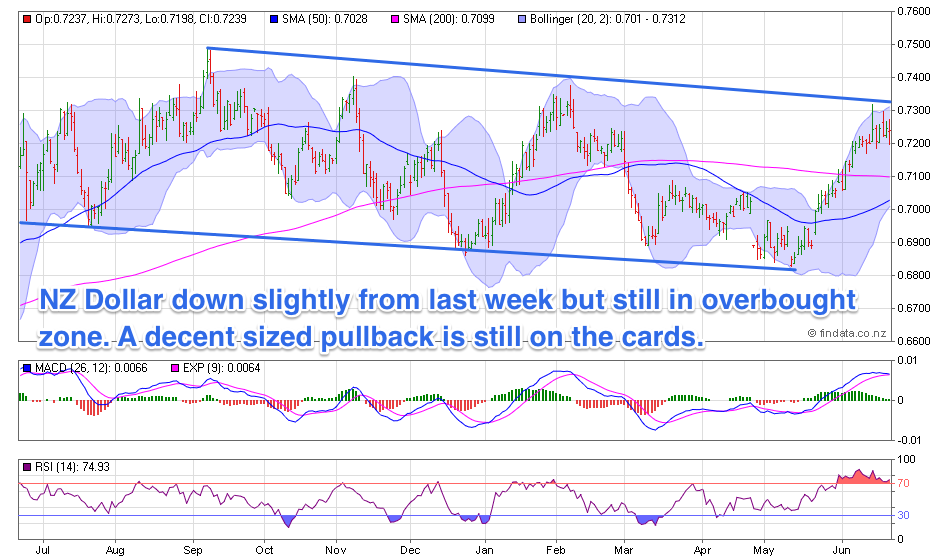
As noted already the Kiwi dollar has been pushing higher, but may struggle to get too much higher in the short term. It did bounce higher after the RBNZ left interest rates on hold this morning, but then pulled back a little. The talk was the RBNZ did not do enough to talk down the recent strength Kiwi dollar so therefore it jumped higher. And could go higher yet.
However the chart below shows the NZ dollar is near the top of the downtrend channel it has been in for the past year.
Other technical indicators are against it too. The RSI overbought/oversold indicator, while down a little, is still above 70 in overbought territory. The MACD also looks to be turning down.
And of course a weaker NZ Dollar translates into higher NZ gold and silver prices.
That combined with US Dollar gold and silver both getting close to touching their respective uptrend lines, means local precious metals prices could be close to a boost higher.
But all these technical indicators are just that – indicators. They only let us make educated guesses on what might happen. Some might argue not even very educated!
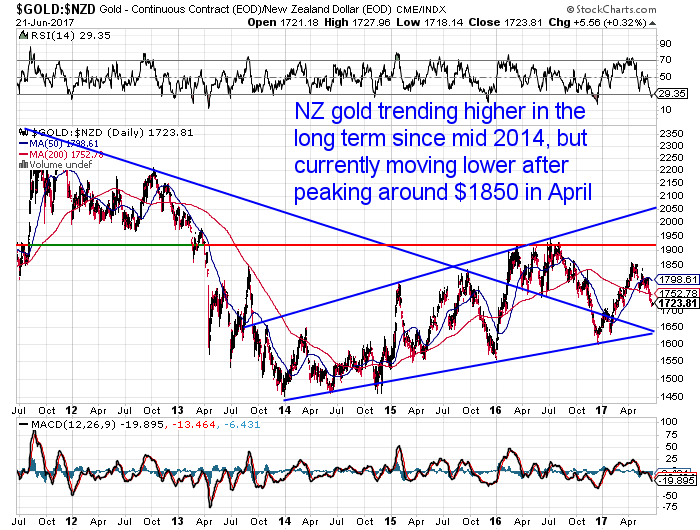
However the longer term charts of both metals in NZ dollars (taken from our daily price alert email) clearly show them in uptrends.
NZD Gold pushing higher for over 3 years.
While NZD Silver has been trending up for over 2 years.
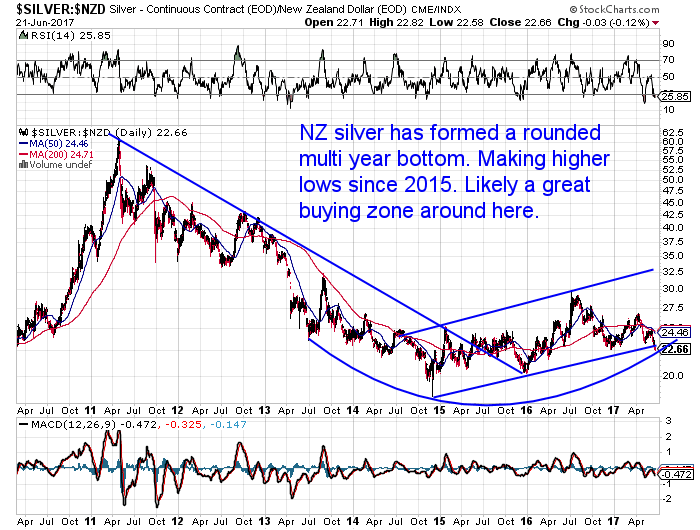
So could they head lower from here?
Of course anything is possible. There sure doesn’t seem to be much positivity towards the metals from what we can see (which actually may well be a contrarian sign).
But given all the indicators outlined above these would seem to be fairly low risk and higher reward entry points for the metals right now.
Gold Near All Time Lows? Huh?
So given we’ve just shown charts of NZD gold trending higher how can gold be nearing all time lows?
Jeff Clark outlines how when adjusted for inflation, or rather real inflation, gold is actually near the lows from 1970 and the early 2000’s.
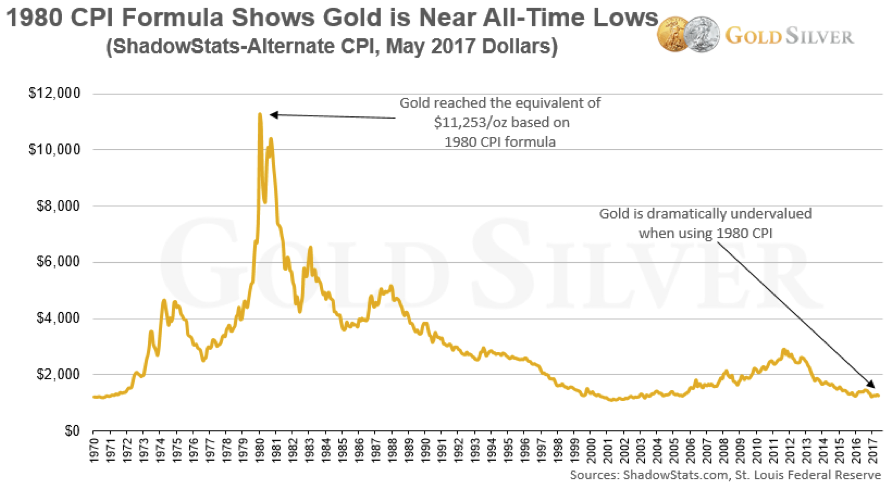
“If we use the 1980 formula to measure inflation—the year gold peaked—you can see the current price is near all-time inflation-adjusted lows. In fact, gold is selling at roughly the same level as the early 1970s, when it was illegal to own in the US!
You can also see that the inflation-adjusted high would be a whopping $11,253 per ounce. Gold may or may not get to 5 figures, but this shows it certainly could if it repeated the performance from the 1970s.
This data tells us that not only is gold dramatically undervalued at current prices, but the potential upside is enormous. If the gold price were to match the return from the past mania, it would have to rise 9 times from current levels!
This paints a completely different picture than looking at the government-tinkered CPI. The current formula grossly dilutes how much inflation has really occurred over the past 37 years. It’s so misleading, in fact, that it could easily lead investors to make flawed decisions, including whether to buy gold.”
Source.
There’s a number of other articles on the website for your perusal as always. So check them out below.
Got a gold or silver related question?
We’ve been a bit stumped on what to write about lately. Call it writers block or winter doldrums. Who knows?
So we’re after your help.
Please just hit reply with any queries or questions on gold or silver related topics and we might just write something about it.
Or call David on 0800 888 465 for a quote or with any questions.
- Email: orders@goldsurvivalguide.co.nz
- Phone: 0800 888 GOLD ( 0800 888 465 ) (or +64 9 2813898)
- or Online order form with indicative pricing


