This Week:
Estimated reading time: 6 minutes
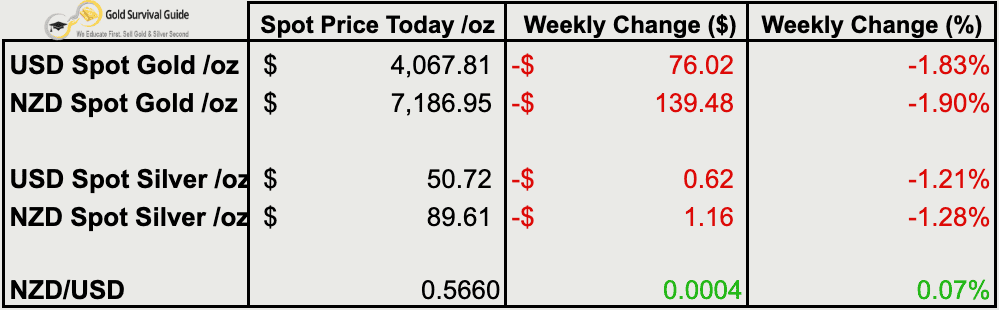
Weekly Price Overview – 19 November 2025
Precious metals corrected further this week. Both gold and silver dipped slightly in NZD and USD terms. The overall pattern points to a sideways consolidation rather than a full-blown sell-off.
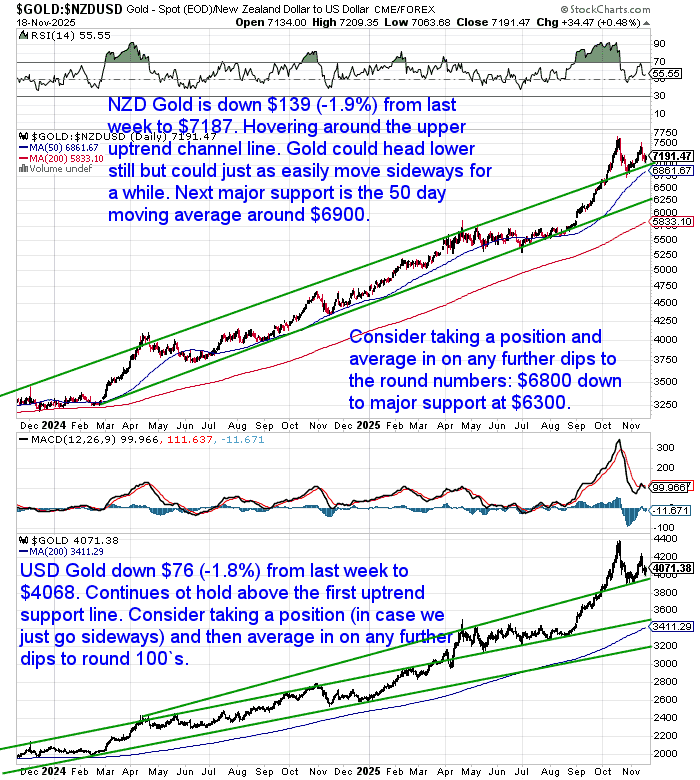
🟡 NZD gold fell $139.48 (-1.90%) to $7,186.95, pulling back to the upper boundary of its rising trend channel. Next support sits around the 50-day moving average near $6,900. USD gold fell $76.02 (-1.83%) to $4,067.81, still holding the uptrend. Dips toward round-number supports ($3,900–$4,000) could still offer opportunities to average in.
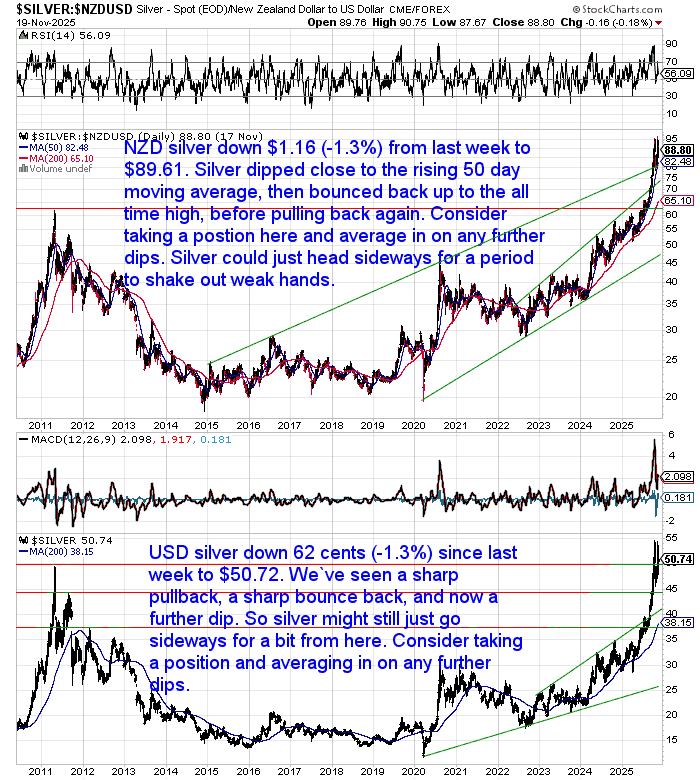
⚪ NZD silver declined $1.16 (-1.28%) to $89.61, briefly touching the rising 50-day average before bouncing back to retest its all-time high. USD silver eased $0.62 (-1.21%) to $50.72 after its sharp bounce the week prior. Consolidation here appears likely as the market shakes out weaker hands.
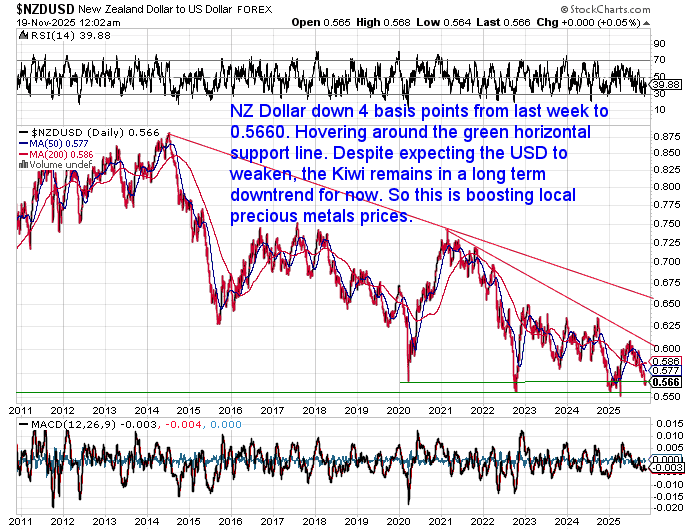
💱 NZD/USD ticked up slightly by 0.0004 (+0.07%) to 0.5660, remaining near long-term support. The Kiwi continues its multi-year downtrend, helping to prop up local metal prices.
📈 Takeaway: After a strong run, gold and silver appear to be moving sideways and digesting gains. Consolidation zones offer good areas to build positions, especially with the NZD still in a broad downtrend.
Should You Buy Gold Now… Or Wait?
Gold has dipped… but most buyers have vanished.
In this week’s featured article, we take a close look at what that might really mean.
Could now be the perfect time to act – or is more patience required?
We break down what we’re seeing in the local gold and silver markets, examine sentiment signals, and share our insights on how to decide if now is the right time to buy.
Click here to read the full guide →

Precious Metals Plunge or Sideways Consolidation?
As this week’s charts show, the precious metals correction continues — but is this just a pause before the next surge?
We’ve seen gold and silver both pull back after big runs up. But rather than panic selling, some analysts are suggesting this could be the kind of healthy consolidation typical of a longer-term bull market.
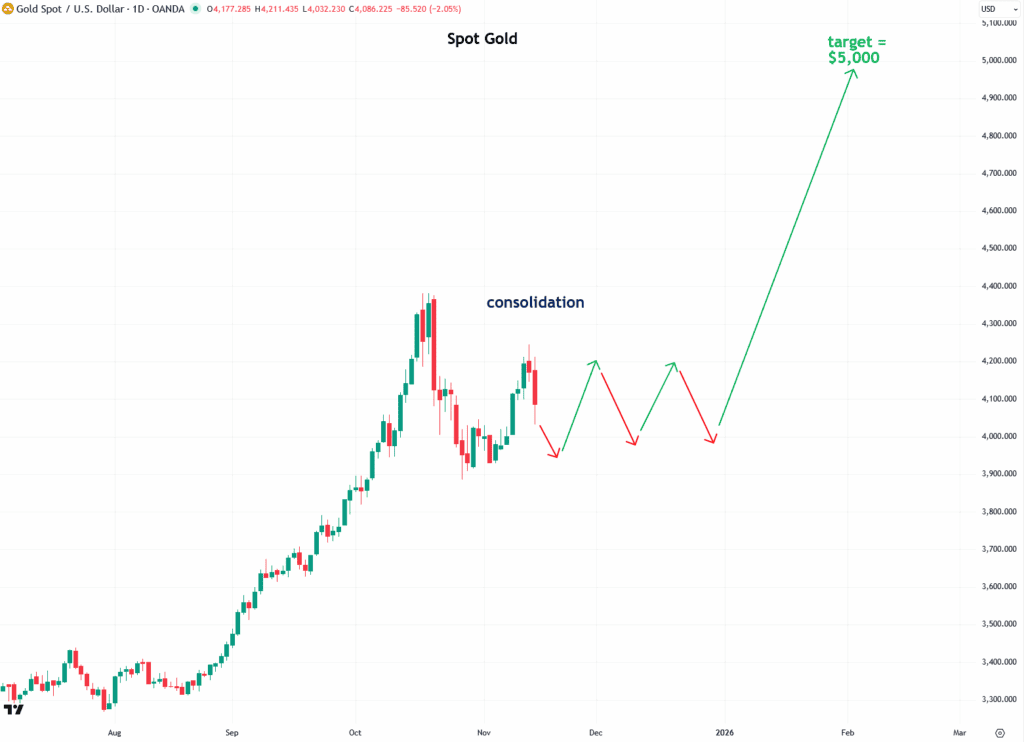
One of those voices is Jesse Columbo, who shared a chart proposing how gold might behave next:
“Gold will likely trade sideways for a while to work off the froth and catch its breath after such a strong surge. That sideways movement involves a lot of bouncing up and down (just like today), until enough energy builds for the next breakout – which I expect will take gold to $5,000 in 2026.”
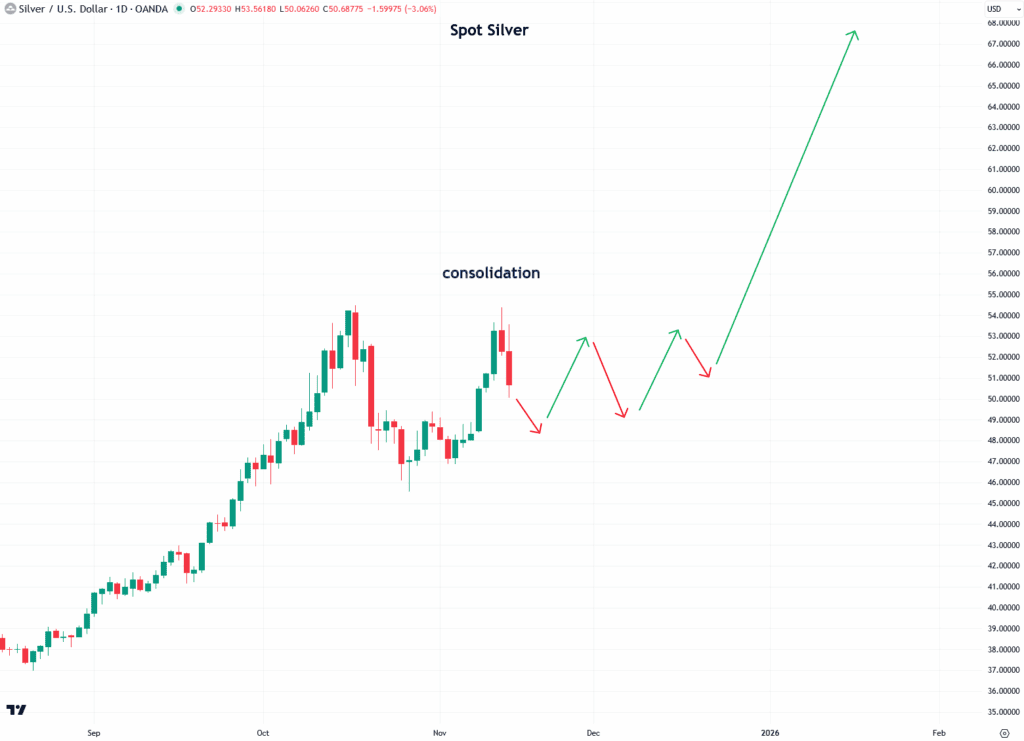
He also addressed the fear around silver:
“After silver’s rebound, I’ve been flooded with messages from retail investors warning that silver has formed a double top pattern – supposedly signaling the end of the bull market.
I strongly disagree.
What looks like a bearish double top is more likely a sideways consolidation that sets the stage for another move higher. When the crowd all sees the same thing at the same time… they’re usually wrong.”
We’ve included both of his annotated charts below.
Source: Jesse Columbo
This also fits exactly with what we’re seeing on the ground here in New Zealand:
As we noted in this week’s featured article, there has been very little buying of this dip in gold and silver.
After such a sharp run-up, it seems most people are waiting for a big drop.
But as Jesse points out — when the crowd all expects the same thing…
“In Every Secular Gold Bull, You Get Savage Pullbacks”
Ronni Stoeferle also touched on today’s hesitation:
[Sidenote: you can watch Ronni’s excellent presentation from the Precious Metals Summit Conferences, LLC in Zurich here. Or download his slides here.]“Pullbacks of 20–30% are normal in secular gold bulls. Miners and silver can swing twice that.
That’s not a bug — it’s the tuition fee for participating in a monetary regime shift.The real risk today is not ‘owning too much gold’.
The real risk is arriving late… and panic-selling the first correction.”Source: Ronni Stoeferle https://www.linkedin.com/posts/activity-7396427102310514688-7PhU
A 20% fall from around US$4400 would still leave gold at ~US$3500 – well within long-term uptrend lines.
But we’d say a more likely scenario is the protracted sideways consolidation that Jesse has outlined – especially because so few are buying this dip.
When buyers hesitate, the market often surprises.
Who Is Buying the Dip?
The retail public in the West has mostly stayed out of this correction. But new data from James Anderson shows who’s been stepping in.
Long-term gold holdings in Western ETFs and depositories have shrunk in the past 4 weeks.
Meanwhile, 20 China-based ETFs have added over 1.15 million ounces of gold.
As he put it:
“Weak hands in the West are selling. China is buying the dip.”
This divergence in sentiment is striking — and supports the broader idea that the market may be consolidating, not collapsing.
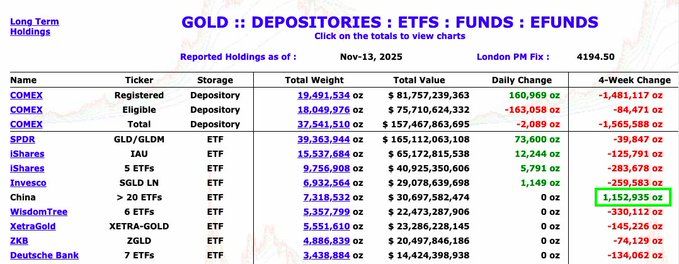
Source: James Anderson
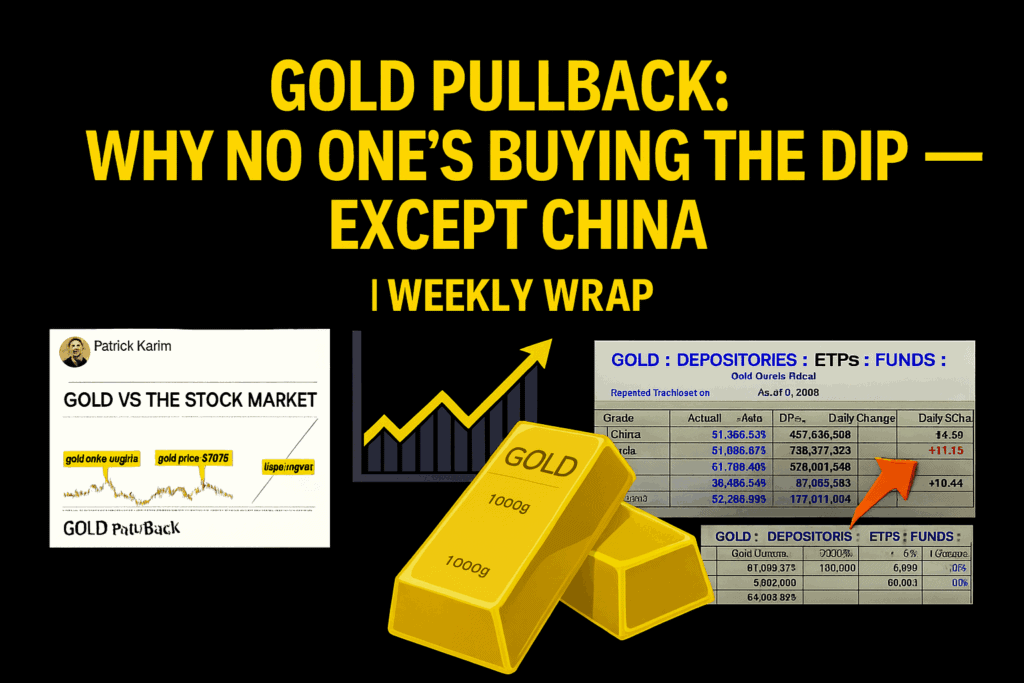
Gold Breaking Out vs. Stocks?
Markets remain jittery. And while gold and silver could dip short term during a stock market correction, history suggests any selling will be short-lived.
But here’s the bigger picture…
This chart from Patrick Karim shows gold is breaking out against the stock market — above a trendline that’s held since 2014. If this holds, we could be entering a period where gold outpaces equities dramatically.
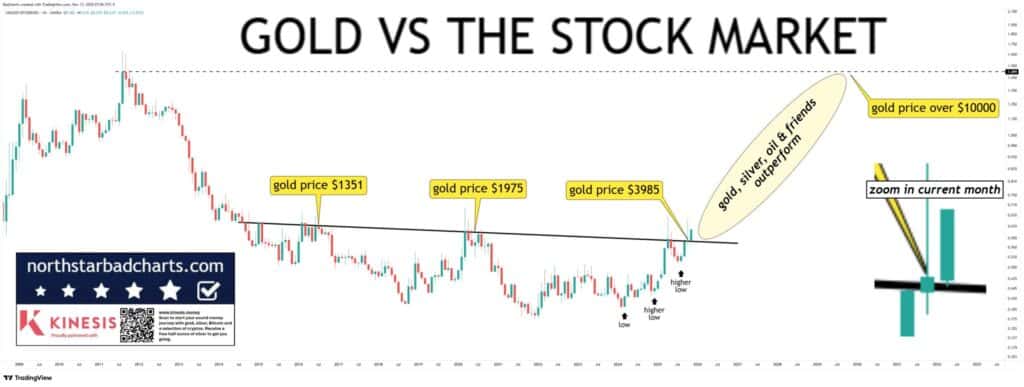
Source: Patrick Karim
From $1350 to $3985… could $10,000 gold be next?
As always, those who wait for perfect conditions usually miss the first leg of the move.
Get in touch for a quote or if you have any questions.