Last week in our article How Much Further Could Gold in NZD Fall? we had a go at looking where gold might drop to if it was to fall further. Our gut reaction was that the recent price plunge was not over and done with and we could likely see at least a retest of previous lows. However it’s fair to say we were a bit on the fence as we could make arguments in both directions – up and down that is.
This week we have a crack at silver in New Zealand dollars and try to guess whether we have seen the bottom or not.
NZD Silver Breakout Imminent
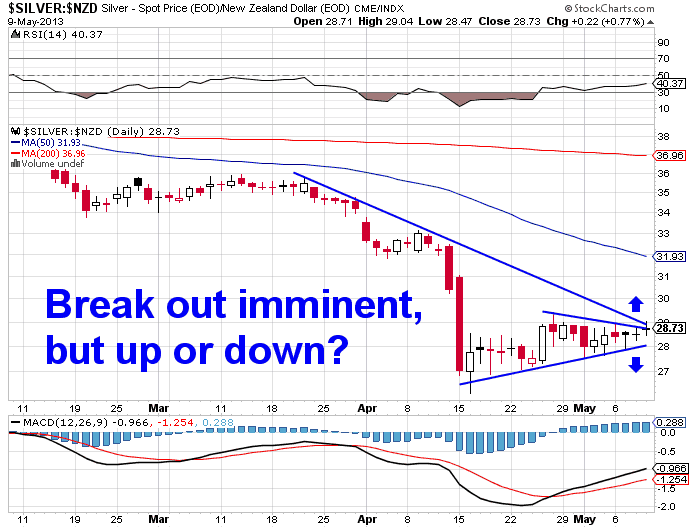
Since the big sell off, silver has tracked steadily up. Not as much as gold but still up. The 3 month chart below shows this move up. You can also see how it is forming a wedge. That is where the trading range gets narrower and narrower each day.
What does this mean?
Well, we are close to the point where the price has to breakout of this “wedge” and go in one direction or the other. No doubt you’re hoping we’re going to tell you which way?
What we can say is that more often than not this wedge breaks out in the direction of the prevailing intermediate trend. Which in this case has been down. Of course there are no guarantees at all. And with sentiment still very low on many indicators we’ve read about lately it could do the opposite just as easily.
NZD Silver – The Big Picture 10 Year Chart
However given on average we could say a break down is more likely, let’s now have a look at the 10 year NZD silver chart for the big picture view.
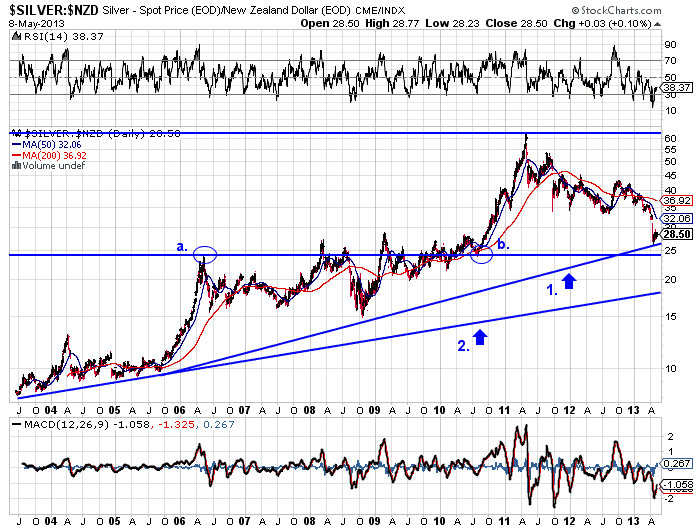
A few things stand out. Firstly unlike gold, NZD silver has already fallen over 50% from its 2011 high of around $62.50. (although the highest closing price was $59.99) The local price touched below $27 per ounce during the massive sell off in April.
Also unlike gold, silver hasn’t risen as strongly after the fall. Currently sitting at $28.50, so up a bit over 5% whereas gold has risen closer to 10% from it’s lows. So there is an argument that silver isn’t looking as strong as gold. Of course the counter to this is that it has already fallen so far from it’s highs that it may well not have too much further to go if it was to drop further. That is, in percentage terms, any fall for silver from here may not be so much as gold.
Where Could NZD Silver Fall to?
The rising support line from late 2005 (labelled 1.), shows silver has held above this so far. There is an even longer term rising support line (2.) further below this. If it touches this surely that would be bargain basement time (perhaps we are already in that zone?).
You’ll also notice the lower horizontal line on the chart which has the 2 points circled a. and b. along it. It’s interesting to note that point a. was the high after the parabolic rise back in late 2005 and point b. was the retest of this level before the parabolic rise of 2010 begin. Parabolic rises like this can retrace 100% of the upwards move. So that would bring it back down to the $24 level where it started from. Therefore we’d envisage that this level of around $24 would prove to be strong support if NZD silver was to fall further.
Technical Analysis – Just a Good Guess.
As someone we know mentioned over dinner earlier this week, charts are only good to see where the price has been, not necessarily where it’s going.
Plus in manipulated markets (regardless of your opinion on this at the very least we have to agree that the price of money i.e. interest rates are rigged by the central planners), technical analysis has even less use.
But as we’ve said in the past they can help identify better points at which to make purchases.
Regardless of your opinion, bottom picking is pretty much impossible. One thing we are pretty confident of is that when this bottom comes (if it hasn’t already) it will likely be the last time we get to see silver (and gold) as low as this. Probably in our lifetimes. There’s our call for the week, check back with us before we die to see if we’re right!
If you have trouble deciding when to pull the trigger then an option is instead to buy regularly, say every month or 3 months or 6 months on the same day. Alternatively keep some fiat cash in reserve in case we do see lower prices but also have some “skin in the game” now in case we don’t. Odds are that anywhere around here will be looked back on as good entry points.
What do you think? What is likely to happen to the silver price in New Zealand dollars? Is the bottom in or will it go lower from here? Show us you’re alive and leave a comment below!
To see how the Gold Silver Ratio is calculated, how it can be used to determine a good time to buy silver, and where it might head to next see: What is the Gold/Silver Ratio?
To learn more about when to buy gold or silver check out this article: When to Buy Gold or Silver: The Ultimate Guide


Pingback: The RBNZ joins the Currency Wars (Sort of) | Gold Prices | Gold Investing Guide
I would like to see Silver price drop a little more to take advantage of lower prices before it takes off, hopefully early 2014 and wouldn’t it be nice to see it clime to USD$200+ over the following few years.
Just my thoughts.
Thanks for taking the time to comment Darrell. I’m sure you’re not the only one who hopes to see the purchasing power of silver increase. Things are very interestingly poised at the moment but odds are we are not too far from the bottom if we’re not there already.
Pingback: NZ Dollar Gold and Silver: Update After the Fall | Gold Prices | Gold Investing Guide
Pingback: Global co-ordinated Central Bank action? | Gold Prices | Gold Investing Guide
Pingback: NZD Gold and Silver Update: Is the Bottom in this Time? | Gold Prices | Gold Investing Guide
Good work, keep it up.