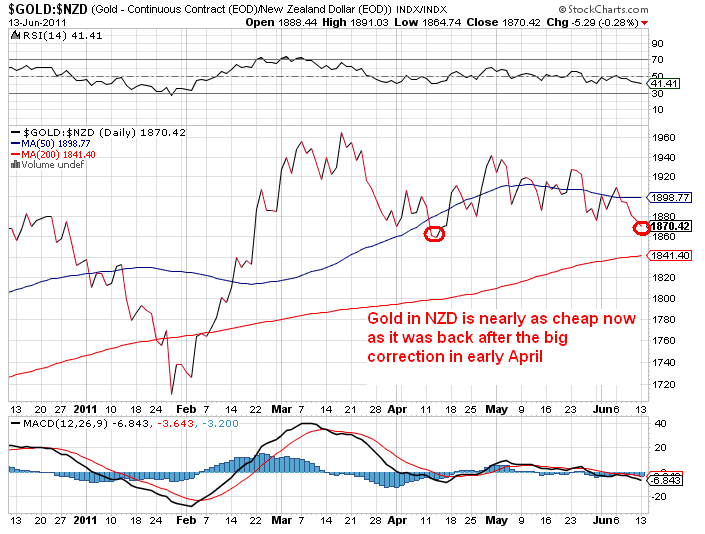
The following article is looking at Gold priced in US dollars, but as we say time and time again it’s the local New Zealand dollar price you need to track (if you’re buying in NZ that is). With the kiwi dollar at record highs this is creating somewhat of a magnified correction with the NZ dollar gold price compared to the commonly quote US dollar price (see the chart below). Nevertheless this article is useful in showing that there were big corrections in the 1970’s bull market even while the price trend was on the way up.

By Jeff Clark, BIG GOLD
The gold price has been rising steadily for almost a year now, with nary a correction. It fell only 4% last month, and the biggest decline since last July was January’s 6.2% drop. These barely register as “corrections” when one considers that we’ve had 18 of them greater than 5% since the bull market began in 2001.
We’re getting used to a persistently rising gold price. Any decline is met with more buying, pushing the price to new highs. But how long can we realistically expect this pattern to continue?
The answer will ultimately be determined by the fundamental factors pushing on the price – more Greece, more money printing, and more economic bad news will all drive gold higher. But even then, have we really said goodbye to big corrections?
History can provide a clue. If we could find a time period within a gold bull market where the price sidestepped major falls, then it might be reasonable to think we’ve entered a period where it will continue steadily climbing. On the other hand, if gold saw big corrections even during, say, a mania, we might need to be on the lookout for them no matter how bullish the factors are today.
Here’s a chart of the corrections that occurred during the final two years of the 1970s mania – one of gold’s biggest parabolic runs in history.

During this historic run, there were seven significant corrections. On average, that’s one every 3½ months and a 10.1% decline. You’ll also see that they were very sharp; four lasted less than ten trading days and all were less than a month. This all occurred in the middle of the mania.
If history is any guide, our correction in January was small, and will be the first of many.
In fact, historical precedent shows that volatility is the norm, even during the Mania Phase of a gold bull market. Big moves, both up and down, are common. I can’t point to a date on the calendar, but sooner or later we’re going to have another downturn, and it won’t be the only one.
This means that great buying opportunities will present themselves regularly. And not just for gold but also for silver. To find out how and when to buy, and what forms of silver you should own, read our FREE 2011 Silver Investing Guide.
