This Week:
- Advice on Reserve Bank Cutting Rates
- More on Rising Interests Rates and Gold
- Gold’s Down. What’s Up With That?
- The Chinese Stock Market Crash and its Impact Down Under
- Are You Wondering if the Bottom is in or at Least Close?
- Similarities Between the 1970’s and Today in the Gold Market
Prices and Charts
| Spot Price Today / oz | Weekly Change ($) | Weekly Change (%) | |
|---|---|---|---|
| NZD Gold | $1648.93 | – $3.50 | – 0.21% |
| USD Gold | $1097.20 | +$2.30 | + 0.21% |
| NZD Silver | $22.33 | – $0.08 | – 0.35% |
| USD Silver | $14.86 | + $0.01 | + 0.06% |
| NZD/USD | 0.6654 | +0.0028 | +0.42% |
Bit of a longer newsletter today. It could do with some cutting down but we’re out of time, so will leave you to read what catches your eye….
As you can see from the table above prices of gold and silver have remained fairly flat compared to the action of the previous week.
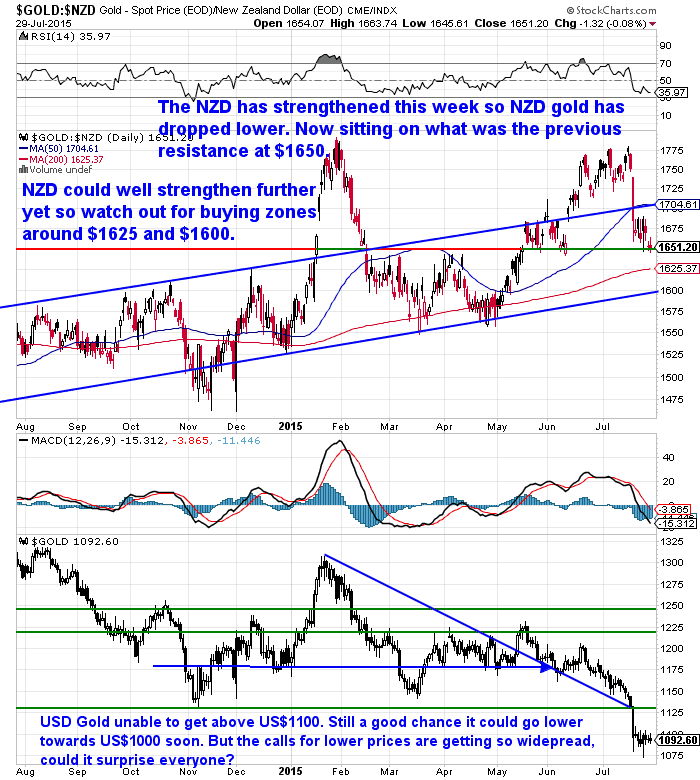
Gold in NZ Dollars is down slightly due to the Kiwi picking up a bit this week.
The NZ dollar could well go a little higher yet in the medium term too.
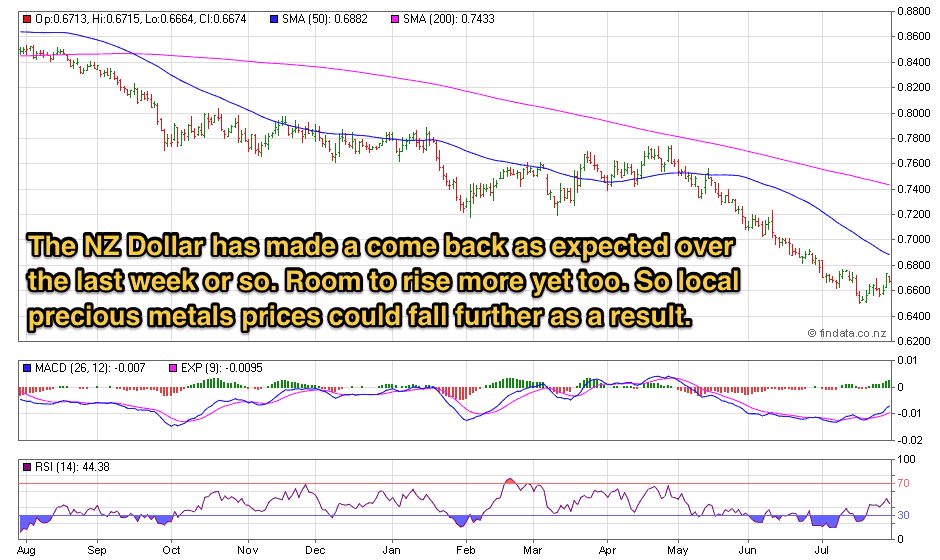
If it does watch out for another couple of lower buying zones for gold.
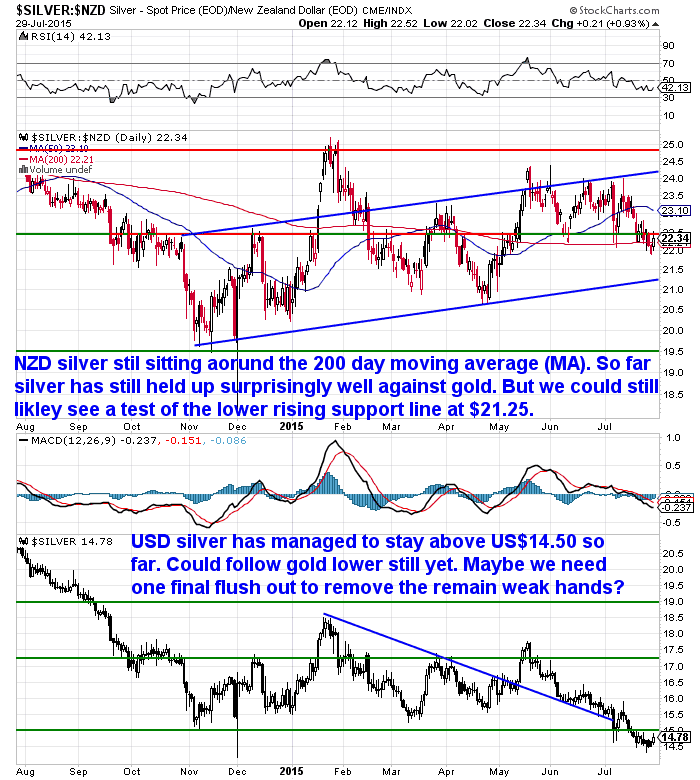
Likewise NZD silver could move down to test the lower uptrend line yet.
New Zealand got a specific mention along with Canada and Australia in a Casey Research note this week…
CASEY RESEARCH: A New Round of Central Bank Easing Has Started… Here’s What to Do
“New Zealand is one of the world’s largest dairy-producing countries. Dairy products like milk and butter make up 21% of New Zealand’s exports.
Like with other food commodities, dairy prices have fallen hard. Dairy products, on average, are 37% cheaper than they were in July 2014.
Bloomberg reports that New Zealand’s economy is “under pressure from the weakest raw-material prices in 13 years.” It added that “New Zealand is suffering from zero inflation after a plunge in whole milk powder prices to the lowest since July 2009.”
Counterintuitively our stock market is holding up well being up 6.0%.
A big reason is that like Canada and Australia our central bank has cut interest rates twice this year.
“Central banks often cut interest rates to stimulate the economy. Lower rates make it cheaper to borrow money… which generally helps a country’s businesses and its stock market.
But low interest rates are generally bad for a country’s currency. “
Indeed this has proven to be the case the NZ Dollar is actually down 25% in the past year. Casey Research’s thoughts on this falling currency…
“A declining currency is bad for its country’s citizens. It makes everyday items cost more. And it makes people’s bank accounts worth less.
This is exactly why we recommend owning physical gold and silver. Governments are constantly making paper money worth less. If you keep all your wealth in US dollars, there’s nothing you can do when the government decides to debase them.”
Touche.
Rates may be falling here but in the US the talk is just the opposite…
More on Rising Interests Rates and Gold
Last week we shared a couple of charts that showed how gold rose with rising interest rates in the 70’s.
Casey Research today covered some more recent research on the topic:
This was expected. Bloomberg reports:
Conventional wisdom says that rising rates are bad for gold. The argument goes that gold doesn’t generate income. So when interest rates rise, people prefer to own bonds and dividend-paying stocks instead of gold.But it turns out that’s dead wrong. The price of gold actually goes up when the Fed raises rates.
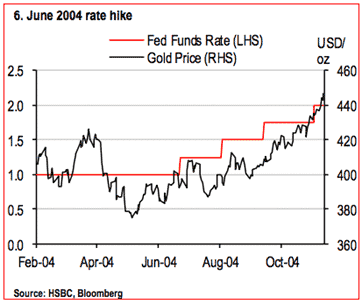
HSBC’s Global Research team found that the price of gold has actually risen the last four times rate hikes began. A recent article by The Reformed Broker explained…
We borrowed this chart from HSBC to show what happened the last time the Fed began a rate hike cycle in 2004. As the Fed raised rates (represented by the red line), the gold price went up (black line):”
 However we’re still not convinced the Fed will raise rates anytime soon. We’ve posted an article this week that outlines some reasons why they may not:
Gold’s Down. What’s up With That?
We also read a good flipside to this argument this week from Chris Sayce in Australia. He argued that the Fed can’t kick off another money printing round while the US Stock market is near its record high.
So he reckons the Feds aim is actually to “push the market over the edge”…
“A small unassisted drop won’t help, because the market will assume the Fed will prevent a plunge.
So, the Fed has to assist…it has to engineer a crash. Hence, the Fed’s determination to raise interest rates this year.
The timing couldn’t be better. After this week’s meeting, the Fed next meets on 16–17 September. Barely two weeks later, US companies will begin releasing third-quarter earnings results.
If, as we expect, those results are disappointing, it will be a bad October for stocks.
Look, we know it’s an ‘out-there’ idea. There’s every chance we’re wrong. But after spending the past six years telling you to ignore each and every fake crisis as it came (and being right to do so), this is the first time since 2008 that we have genuine worries about the market.
Even if we’re half right on this, the time to prepare for it is now and over the next two to three weeks.”
This could increase the government’s short term borrowing costs by a decent chunk.
Chris Makes the point that:
“…interest rates are at record lows. Also remember that a lot of what central banks are doing today is trial-and-error.
No one (including them) really knows the impact of years of low interest rates on the markets and the economy. But, while we don’t know for sure, we can make a good educated guess.
You may see a short-term boost in stock prices from an interest rate increase, as a natural knee-jerk reaction. After all, that’s what has happened to stocks before.
But remember, every previous interest rate rise has led to a recession. This will be no different.
The only difference is that the lag between the rate rise and the beginning of the recession will be much shorter than in the past.”
A Detailed Take on China
If you’ve got a few minutes to spare this David Stockman article does a good job of highlighting the difficulties in China at the moment. Outlining how much of a global impact a real slow down there will have.
The Chinese Stock Market Crash and its Impact Down Under
Greg Canavan brought up some good points about the possible impacts of China’s tumbling sharemarket and slowing economy for Australia this week. Most of which apply to NZ too we think…
“–Where China goes from here is anyone’s guess. You’ll likely see more easing measures very soon. But will it help? One thing to keep in mind is that China is a creditor nation. Cutting interest rates (and lowering the return on savers’ deposits) is bad for consumption.
–China doesn’t have many choices left. My guess is that at some point they will need to break their peg to the US dollar and devalue. The strengthening US dollar is a real problem for them, especially as Japan’s yen weakens and they lose competitiveness in the region.
–Something will have to give pretty soon, and I think that it will be the currency. This is not something global capital markets expect, which means traders are not positioned for it. So any change of policy around the currency peg could cause a major bout of volatility.
–For starters, who knows how much US or foreign currency debt Chinese companies hold? A devaluation could push up debt levels and servicing costs and cause stress in some parts of the financial system.
–There will be winners and losers from a currency devaluation, but the authorities will have to decide which is the lesser poison. Put simply, no decision is without consequences. From here, China only has hard choices. Soon, they’ll simply have to take their medicine. That will be a good thing in the longer term. But in the short term it will hurt.
–A devaluation of the yuan could also hurt Australia if it reduces capital flight out of China by reducing the purchasing power of the currency. As you know, Chinese capital is flooding into this country. It’s helping to support the property market at a time when you’d expect weaker prices on the back of slower economic growth and rising unemployment.”
Most would have expected that when China finally ended its peg to the US dollar it would have to rise. Recall the US government allegations of “currency manipulation” by China only a few years ago were that the Yuan was artificially low not high!
But this point that the Yuan might well fall instead is worth considering. The same impacts on Australia would apply here. The Yuan peg to the US dollar has increased the purchasing power of the Chinese currency here in New Zealand markedly over the past year or so as the US dollar has strengthened and the Yuan followed.
So if the peg was cut and the Yuan fell, we would like Aussie see a drop in the amount of capital fleeing China and arriving here.
Perhaps that will put a stop to rising house prices if in fact it is only “the Chinese” that are driving them up?
But a final point from Greg could just as easily be written about us here in NZ:
“But remember, selling property (either directly or via bank debt) to finance our excess consumption is a key plank of our economic growth model. As flawed as it might be, politicians and regulators will do just about everything to keep this model going.”
Late Addition: The slowing up of capital from China might be already happening in Australia at least…
The Australian Financial Review (subscription required) reports:
‘The Chinese sharemarket correction and tightening of local banks’ lending to overseas investors could slow foreign investment in Australian property markets, according to property specialists.
‘Andrew Fawell, director of the Beller Group, a diversified property group with offices in Shanghai selling Australian property to Chinese investors, said there is anecdotal evidence some investments could be axed because buyers have suffered heavy losses on China’s bourses.
‘”Reports are coming in of investors claiming they have lost all their capital on the stock market and cannot go through with the deal,” Mr Fawell said. “The Australian market has to be braced for unexpected events.”’
Preparation also means having basic supplies on hand.
Are you prepared for when the shelves are bare?

For just $395 you can have 60 days long life emergency food supply.
Learn More.
—–
Similarities Between the 1970’s and Today in the Gold Market
We’ve mentioned in a couple of recent articles how gold dropped by about 50% in the mid 70’s. And how this current correction bears some similarity.
Well here’s some VERY exact numbers from the National Inflation Association:
“Between January 1970 and December 1974, gold rose 456.6% from $35.08 per oz to $195.25 per oz, which was followed by a 47% decline to a low in August 1976 of $103.50 per oz. Afterwards, gold rose 721.3% to a high in January 1980 of $850 per oz.
Between April 2001 and September 2011, gold rose 630.4% from $259.45 per oz to a high of $1,895 per oz. Since gold’s peak, it has declined by 43.1% to a current price of $1,078.50 per oz. Just like in the 1970s, gold has been experiencing a medium-term decline, as part of a secular bull market.
Too many people were bullish on gold at $1,895 per oz. For gold to rise to $2,000 and beyond, we needed to first see a decline that turns everybody into bears – even the so-called “gold bugs”.China’s recent announcement of their latest central bank gold reserves disappointed many of the “gold bugs”, who were expecting China to announce an even larger increase than it did – that would trigger a massive gold rally. With their one last hope for gold $2,000 now gone and no further short-term catalysts in sight, the “gold bugs” are finally throwing their hands in the air and giving up on gold, which means true capitulation is almost here.
During gold’s 1974-1976 decline of 47%, it had two false bottoms at $128.75 per oz and $124.60 per oz, before true capitulation occurred with gold eventually bottoming at $103.50 per oz. During gold’s current decline of 43.1%, it has already experienced two false bottoms: one in June 2013 at $1,192 per oz and another in November 2014 at $1,142 per oz. The fact that these two bottoms didn’t hold, has totally frustrated the most loyal “gold bugs” – who will likely end up selling at the exact bottom. If history repeats itself, we could see gold ultimately settle at $1,004.35 per oz(down 47% from its medium-term peak), followed by a move to $8,248.73 per oz (up 721.3% from its medium-term bottom).”
Are You Wondering if the Bottom is in or at Least Close?
As alluded to above we could well be close to the point of “true capitulation”.
Another positive sign is that hedge funds are now holding a ‘net short’ position in gold for the first time since 2006.
Why might this be a good thing?
Well back in 2011, around the time gold peaked near $1,921, hedge funds were at an extreme net long position.
So when they reach extremes maybe it makes sense to do the opposite?
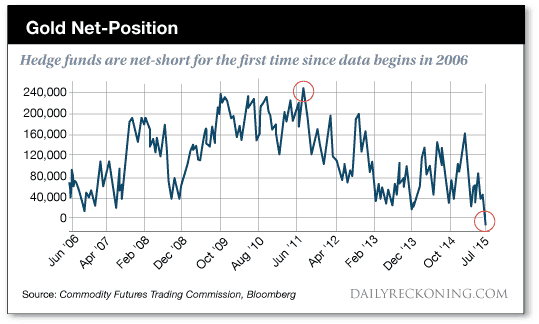
Greg Canavan from whom we snatched the above chart notes:
“You’re seeing an increase in bearish articles on gold. You’re seeing bearish bets on the metal increase to record levels. That tells you this market is getting close to a bottom.
It doesn’t matter what market you’re talking about, whether it’s coffee beans or soybeans or stocks in Apple. Whenever anything seems so obvious that it’s a sure bet, a turning point is close.
I don’t know if this is the bottom for gold or whether it will first breach the $1,000 mark, as nearly everyone seems to expect. You could see another decent rally from here before the final, gut wrenching sell-off. But’s it’s getting close.
Gold benefited from some ‘short-covering’ in US trade on Friday on the back of renewed uncertainty about Greece. Short covering occurs when traders buy back the gold they had previously sold in order to ‘cover’ their position. This saw gold rally from just under $1,080 to around $1,100 an ounce.
Still, gold is in a nasty downtrend. The path of least resistance is down. My guess is that you’ll want to see something like a $50 an ounce short-covering rally to gain confidence that the market might be turning.”
Bad News = Good News?
We’ve seen a few negative stories on China’s lack of buying following the recent gold plunge like this one, unlike what occurred in 2013.
However China’s increased demand has had little impact on pushing prices higher in the past couple of years. As for now the price is still set in the western futures markets.
So perhaps lower demand in China might also not have as much impact as some might think?
“China and India are the world’s top gold consumers. Physical demand there has not picked up strongly despite a sell-off last week that knocked global prices to 5-1/2 year lows.
That contrasts to the explosion in physical demand seen after gold prices dropped sharply in the second quarter of 2013.”
Source.
We can’t say the bottom is in but there are certainly growing signs pointing to it being closer than ever.
This Washington Post article that the NZ Herald featured on Monday is another one of them.
Titled “Here’s why gold is doomed”, it is rather disparaging of “Gold Bugs” and how wrong they have been.
We think the smugness of this writer will likely come back to bite him down the track when his article proves to have come at pretty close to the bottom in gold.
Actually there’s been a veritable feast of negative gold and silver articles in recent days. We’re spoilt for choice! Here’s a couple of other dismissals:
This one sounds remarkably like Warren Buffett’s arguments against gold.
A Societe Generale analyst says “Gold is out of fashion like flared trousers: no one wants it,”
While Germany’s Deutsche Bank analysts say “Gold would need to fall towards $750 per ounce to bring prices in real terms back towards long-run historical averages.”
“[Even after] this substantial correction…the long-term record shows gold literally spent decades trading below $400.” Source.
This one takes the cake though. Adrian Ash reports:
“Get ready for $350 gold,” says a MarketWatch headline…quoting an academic who apparently forecast the plunge in prices back in 2012.
Only, he didn’t. Read the paper which MarketWatch cites, and what the 2012 research actually said was that gold might go down…or it might go up.
A proper two-handed economist then…
…right up until the downtrend in gold has already lopped 40% off the price…and calling it lower becomes all the rage.”
This was you’ll not only get a decent overall price, but psychologically you’ll likely feel better. If the price falls you’ll have funds to buy some more. If it goes up you’ll already have some at lower prices.
As always let us know if you have any questions.
Free delivery anywhere in New Zealand and Australia
We’ve still got free delivery on boxes of 500 x 1oz Canadian Silver Maples delivered to your door via UPS, fully insured.
Todays price is $13,865 and delivery is now about 7-10 business days.
This Weeks Articles:
|
|||||||||||||||||||||||||
|
|||||||||||||||||||||||||
|
|||||||||||||||||||||||||
|


Pingback: Is Inflation Going to Surprise Us? - Gold Survival Guide