Gold has just made another all time high priced in US dollars reaching an intra-day price of $1261.90. In Euros and sterling and many other currencies it also has hit new highs recently.
Here in New Zealand, while it has rallied sharply since the start of May, the previous February 2009 high of $1980 has yet to be breached as can be seen further down the page on the 2 year chart of the New Zealand Dollar Gold Price. In early June it touched $1900 briefly but has since fallen away sharply.
The mistake many new gold investors make is trying to guess where the price is going. They either sit on the sidelines waiting for the price to get cheaper while it rises and rises, or they jump in when the gold is hitting mainstream headlines as it makes new highs, only to subsequently see it fall steeply. Often they make their initial purchase in one big hit hoping to pick the “bottom” and then see their purchase lose 10 or 15% in no time.
We prefer not to guess where the price is going and rather buy at regular intervals, ensuring a good price overall.
However we also like to keep some “powder dry” for when the price dips, and this is when it is useful to keep an eye on the charts to pick buying zones where you can grab some bigger handfuls.
Technical analysis is as much an art as a science. You could ask 5 or 6 technical gurus about a chart and probably get 5 or 6 different answers! And particularly in these days of manipulated markets it is of dubious value.
However, technical analysis does have some predictive value, chiefly because so many people use it, so it’s worth taking into account when making purchase decisions in our opinion.
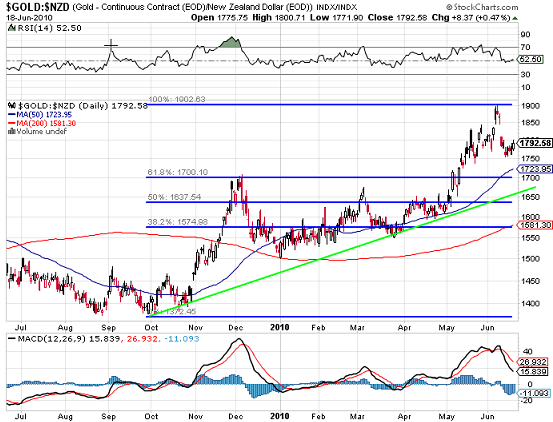
The 1 year chart below has Fibonacci retracement levels drawn in from the recent high at $1900 back down to 0% at $1372 last October. You can see $1700 at the 61.8% retracement and $1637 at the 50% level.
1 Year NZ Dollar Gold Price Chart with Fibonacci Retracements
Also worth taking into account is the 50 day moving average (red line) of $1723. Further below is the 200 day moving average at $1581. You can see on the 1 year chart that the price has not dipped down to touch the 200 day moving average (red line) since the start of the year.
These price levels all offer good “support” in technical terms, so in our opinion, could likely be good buying zones.
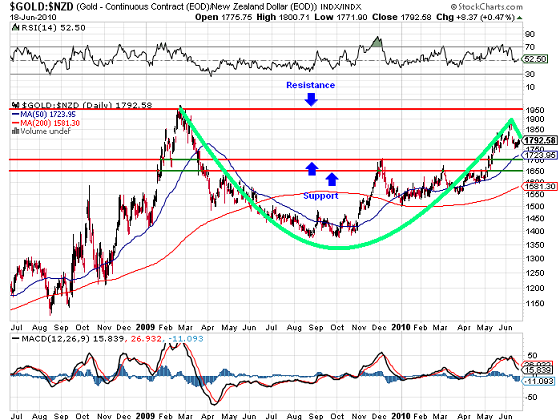
2 Year NZ Dollar Gold Price Chart – Cup and Handle Pattern
The 2 year chart above has a very interesting look about it, namely, in chartist terms, what is referred to as a “cup and handle”. You can see the cup highlighted in green. This is known as a “bullish continuation pattern” and while it is usually seen over a period of months rather than a year and a half it is worth looking at more closely. For a full description of the cup and handle pattern.
The handle usually trends down for a short period before eventually heading up and breaking out and recording new highs.
So from here we could see the price head up to test $1980 and with then possibly a “handle” forming, or maybe we are already witnessing the formation of a handle. If this break out were to occur we can make an estimate of an upside target by taking the difference between the bottom of the “cup” at $1400 and the high of approximately $1950. Adding the difference of $550 to the current high gives an upside target of $2500.
Of course a “double top” may occur where the price rises to test the $1980 resistance but fails to break through this level and we might then see the NZD gold price fall significantly. However unlike the February 2009 high, we haven’t seen a sharp rise in the space of a few months but rather a series of sideways movements followed by some steady gains. So you could say we are at a lower risk of a significant breakdown in price than we were in February 2009.
As always, these are just our opinions. The charts clearly demonstrate that the gold market is a very volatile market, however, this makes for opportunities, so long as you have a plan to handle this volatility. A plan which could be as simple as buy the dips and keep buying until your big picture view of the global financial landscape hints at some real improvement, which we haven’t seen a lot of as yet, and which looks increasingly unlikely, given the current economic and financial situation.
Note: Both live and historical gold and silver price charts in New Zealand dollars are available here: Gold Prices


