Gold Survival Gold Article UpdatesFeb 19, 2015
This Week:
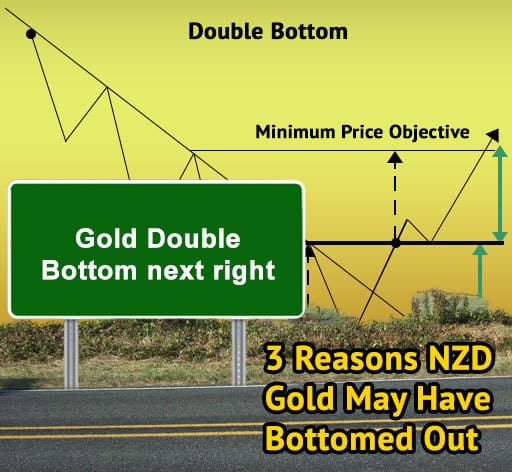
- 3 Reasons NZD Gold May Have Bottomed Out
- 10 Inventive Hiding Places To Store Your Gold, Silver & Valuables
- More on falling interest rates

Check out this weeks feature article if you’re wondering what to do with your precious metals once you’ve bought them:10 Inventive Hiding Places to Store Your Gold, Silver & Valuables.
Plus there’s two more articles worth reading on the website at the end of this email…
Prices and Charts
| Spot Price Today / oz | Weekly Change ($) | Weekly Change (%) | |
|---|---|---|---|
| NZD Gold | $1658.34 | – $56.67 | – 3.41% |
| USD Gold | $1221.70 | – $13.24 | – 1.06% |
| NZD Silver | $21.82 | – $1.05 | – 4.59% |
| USD Silver | $16.46 | – $0.39 | – 2.31% |
| NZD/USD | 0.7367 | + 0.0178 | + 2.41% |
Gold and silver both fell further this week. With the Kiwi dollar strengthening at the same time, it impacted the local gold and silver prices even more as you can see by the percentage moves in the table above.
As you can see in the chart below the big move up from NZ$1600 to $1775 in January has now been almost fully retraced. We have moved from overbought to almost oversold now too.
So odds favour the price starting to bottom out somewhere close to here now we reckon.

Silver has also retraced most of the move up that occurred in January. Although given all the talk of deflation around currently, silver has actually held up surprisingly well. (Given its greater industrial usages silver would be expected to underperform in a deflationary environment).

3 Reasons NZD Gold May Have Bottomed Out
Number 1.
As noted already NZD gold has retraced almost all of last months very sharp move upwards. So that is one factor that could lead to the price leveling out around here.
But there’s a couple of other technical reasons we think are positive for NZD gold.
Number 2.
This one is inspired by Greg Canavan of the Aussie Daily Reckoning discussing how the Australian dollar gold price could rally while the USD gold price doesn’t move much.
—–
“–There ARE headwinds for US dollar gold. I acknowledge that. But we’re deep into an historic monetary experiment and things are starting to turn ugly. There’s no reason why gold and the greenback can’t rally together.
–But in Aussie dollar terms, it looks like the long bear market may be coming to an end. This is not just my opinion. In a market as opaque and as large and complex as gold, opinion is worthless.
–You have to look at the price action to see whether the market endorses your idea…
–In the case of gold, we’ve been watching the sector closely for months. Aussie dollar gold recently broke out of a long term trading range and in many cases, Aussie dollar gold stocks have too. Newcrest Mining [ASX:NCM] for example has increased a whopping 64% since bottoming in November last year.
–We could be wrong of course, but the early indications are that this is not just another bear market rally, of which there have been a few for gold stocks in recent years. Many stocks are showing signs of starting a new long term uptrend. It’s early days, but the signs are good.
–Perhaps the best indication for the bullish thesis for Aussie dollar gold is in the chart below…
–It shows a VERY long term chart — Aussie dollar gold over the past 20 years, on a monthly time scale. As you can see, gold has spent the past three years in a consolidation pattern, marked by the triangle shape.
–These shapes are very common, and when there’s a definitive break out of the range, it tends to confirm the resumption of the dominant trend — in this case, a bullish one.
–Keep in mind this is a monthly chart, so don’t expect the gold price to keep rising right away. More than likely, you’ll see a correction after such a strong breakout. In fact, we’re probably in the early stages of one now.
–But if the breakout pattern holds, then in the years to come you can expect to see Aussie dollar gold making new highs.”
—–

Here’s the NZD Gold version of the monthly chart – showing the same breakout from a consolidating triangle. Of course we don’t stake our lives on technical analysis. However it is useful to show where the price has been. In this case it is showing that on a monthly basis NZD Gold has broken out of a consolidating pattern of over 3 years. So that is a pretty bullish factor.

Number 3.
We need to revisit an article we wrote back in August last year for this one.
Another Gold Indicator Flashing Buy
This also looked at a long term chart of the monthly closing price of NZD gold. But rather than analysing what the price was doing, this one used a change in the moving average convergence divergence (MACD) indicator.
If that’s all Greek to you then just go back and read the article as it quickly summarises the MACD and what it means.
But in a nutshell the chart lets us look back over the past 10 years and clearly see a number of situations where the shorter-term black trend line crosses above or below the longer-term red trend line. We marked these on the chart with arrows.
Red arrows for a sell signal with the shorter term black trend line crossing below the longer-term red trend line.
Green arrows for a buy signal with the shorter term black trend line crossing above the longer-term red trend line.
These signals matched up nicely with falling or rising NZD gold prices soon after (see the corresponding arrows in the top part of the chart). Apart from the period from mid 2010 to mid 2011 where we had multiple buy and sell signals (see the blue oval). So like any technical indicator this one is not infallible.
But apart from this period, the crossing over of the shorter term and longer term trend lines have proven quite useful to follow as a timing indicator.
This was the chart as published back in August last year…

How have things played out since then?
Below is the updated chart showing the gold price in NZD has definitely moved up since then. So this indicator might well be proving correct. If it is and if history at least ryhmes the NZD gold price has likely still got some way higher to run in the next year or 2.

Negative Interest Rate Club Gets Another New Member
Last week we spent a good deal of time talking about interest rates. In particular how the central banks of the likes of Switzerland and Denmark are employing negative interest rates to force banks to lend and investors to invest.
Well, that club got a new member this week with Sweden now charging a 0.10% negative interest rate. (Ambrose Evans-Pritchard gives a good summary of it here.)
On top of this they are also doing a big dose of bond buying which we guess is meant to cook up some inflation or keep the much talk about deflation at arms length anyway. But just as likely make their exports cheaper.
Then overnight Indonesia cuts its interest rate causing the Rupiah to fall.
So it seems little by little, country by country, everyone is trying to weaken their currency by making it less attractive to investors to hold it.
The New Zealand Reserve Bank is no different. While not (yet?) cutting interest rates, they are still trying to talk our currency down and of course changed course at the last announcement from a dead certain rate rise to just being neutral.
Of course not everyone can have a weak currency at once, but it seems they are trying.
Actually hold that thought. Everyone can have a weaker currency – at least against gold and silver.
We think these globally falling interest rates are likely to be a driver of people into gold and silver.
As we noted last week it’s just about the quietest it has ever been for us in terms of gold and silver sales. We wrote way back in May 2013 when gold plunged “a true bottom often comes when no one wants to buy and so the selling has been exhausted. So if this was the case we are not there yet for gold.”
Well there’s certainly very little buying currently. This factor coupled with the other few reasons we outlined earlier could well mean that the bottom is in for gold and silver. That would make this a pretty good time to buy.
If you agree, get in touch for a quote. Given current interest you likely won’t be waiting in line to talk to us!
Free delivery anywhere in New Zealand and Australia
We’ve still got free delivery on boxes of 500 x 1oz Canadian Silver Maples delivered to your door via UPS, fully insured.
Todays price is $13,250 and delivery is now about 7-10 business days.
This Weeks Articles:
 |
|
 |
|
|
|
 |
|
As always we are happy to answer any questions you have about buying gold or silver. In fact, we encourage them, as it often gives us something to write about. So if you have any get in touch.
|
| Today’s Spot PricesSpot Gold | |
| NZ $ 1601.67 / oz | US $ 1208.46 / oz |
| Spot Silver | |
| NZ $ 21.82 / ozNZ $ 701.47 / kg | US $ 16.46 / ozUS $ 529.26 / kg |
| 7 Reasons to Buy Gold & Silver via GoldSurvivalGuideToday’s Prices to Buy |
|
1oz NZ 99.99% pure gold bar
|
|
1kg NZ 99.9% pure silver bar
$764.37 (price is per kilo only for orders of 5 kgs or more) |
 |
|
1oz PAMP Suisse 99.99% pure gold bar
|
|
1kg PAMP 99.9% pure silver bar
|
|
1oz Canadian Gold Maple 99.99% pure gold coin
|
|
1oz Canadian Silver Maple 99.99% pure silver coin (Minimum order size tube of 25 coins)
Box of 500 $13250 (Fully insured and delivered) |
|
|


Note:
|
|
Can’t Get Enough of Gold Survival Guide? If once a week isn’t enough sign up to get daily price alerts every weekday around 9am Click here for more info |
|
Our Mission
|
| We look forward to hearing from you soon.Have a golden week!
David (and Glenn) Ph: 0800 888 465 From outside NZ: +64 9 281 3898 |
 |
 |
|
The Legal stuff – Disclaimer: We are not financial advisors, accountants or lawyers. Any information we provide is not intended as investment or financial advice. It is merely information based upon our own experiences. The information we discuss is of a general nature and should merely be used as a place to start your own research and you definitely should conduct your own due diligence. You should seek professional investment or financial advice before making any decisions. |
|
Copyright © 2013 Gold Survival Guide. All Rights Reserved. |
Pingback: Beginners guide to technical analysis - Gold Prices | Gold Investing Guide