It’s been over 2 months now since the late June lows for gold and silver so we thought it worth a look back at what we wrote a month prior to this to see how things have played out since the initial massive plunge in April. With the benefit of hindsight lows are much easier to spot, so is one in now?
First let’s recap what we wrote back on 22 May. This was about a month after the initial plunge in April. In NZ Dollar Gold and Silver: Update After the Fall we wrote with regard to the NZ dollar gold price chart:
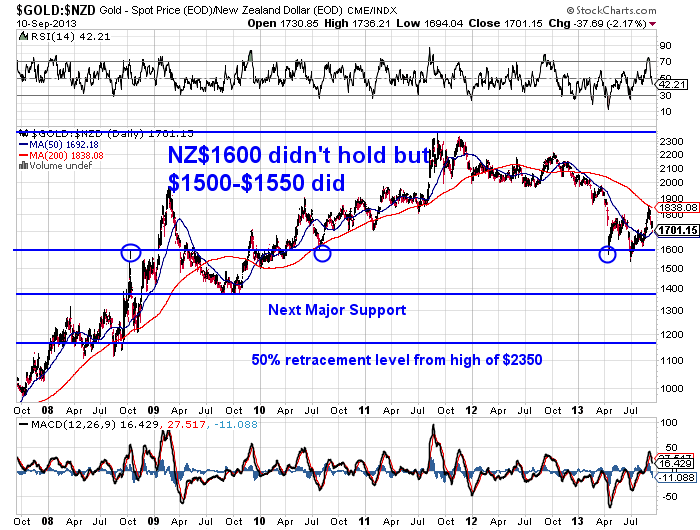
These circles indicate the low of last month, the low in the middle of 2010 (support) and the high in 2008 (resistance). We still have a feeling we might at least retest this area below $1600 at some stage. But for now the weaker kiwi dollar means that it remains over $100 per ounce below where we are today.
Our “feeling” proved right as we did see the NZ dollar denominated gold price drop further. Below is an update of that same graph. You can see the 3 circles we referred to back then on the support line at NZ$1600. And indeed this line did not hold and we dipped down below it in late June to around $1550.
Since then gold has powered higher, particularly so through the month of August. It touched the 200 day moving average (red line) at the end of August and has since corrected back down and looks very close to testing support at the 50 day moving average (MA) at $1692.18.
Turning to Silver Now
Back in late May we said:
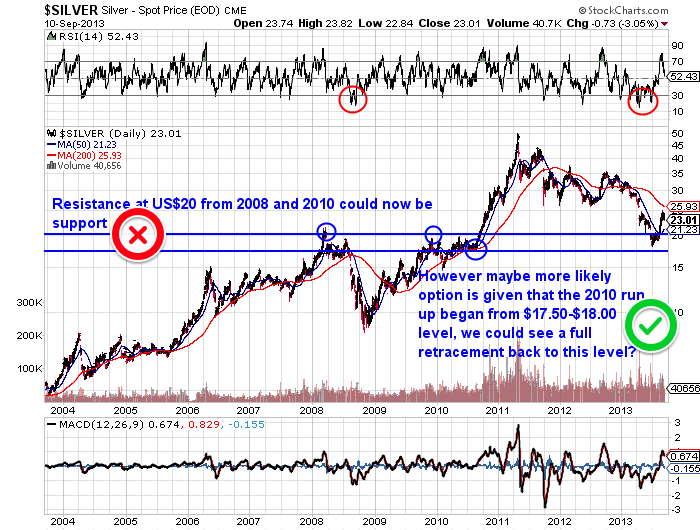
[W]e just have a feeling there could be more weakness ahead yet for silver to shake the last of the “weak hands” out. If we look at the US dollar chart we can see that yesterday’s intraday plunge saw the $20 level come in as strong support. But we just have a feeling this level could be tested a bit in coming weeks we reckon. We can see the parabolic rise in 2010 began from the $17.50-$18.00 region so we reckon there may be a retracement right back to around there.This would also mirror the “double bottom” that occurred in the RSI back in 2008. If this did occur it would be the most oversold the RSI has been during this bull market.
Below is the updated silver chart in US dollars, although it still has our comments from back in May on it. The resistance line from 2008 at US$20 did not hold up (see the red X). And we did get a double bottom in the RSI as indicated by the red circle. As suspected though the $18 region was tested and did offer strong support (see the green tick) and we have seen a strong move higher from there.
What About Silver in NZ Dollar Terms?
In late May we said:
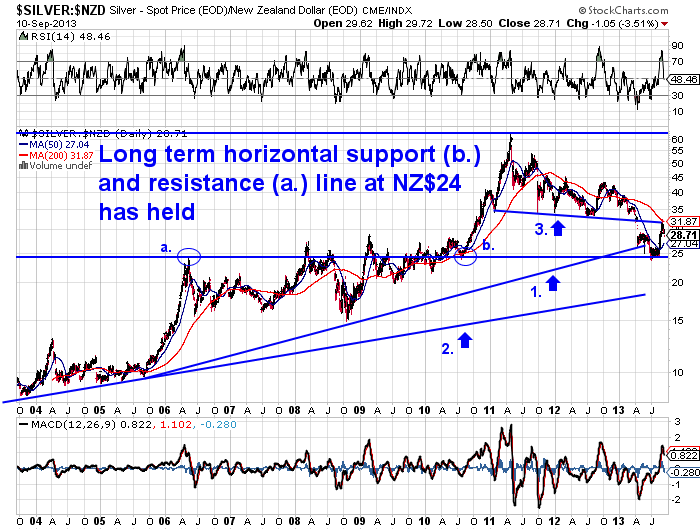
Looking at the updated 10 year chart we featured Friday week ago, the intraday spike down on Monday went briefly below the uptrend line labelled (1.). But the price is still above the $24 region shown by the horizontal support/resistance line with points a. and b. circled on it. As we said in the previous article this is likely to be strong support given it’s where the 2010 run up started from (circle b.).
Below is the updated chart showing that the NZ$24 long term horizontal support and resistance line was tested as suspected and did offer strong support and since then has held.
Silver surged higher even more so than gold since late June. It too has bumped up against its 200 day MA and is in consolidation mode now.
So back to our earlier question, with the benefit of hindsight…
Is a Low in Now for Gold and Silver?
As we stated in May, “our hunch is that the bottom will arrive when there is very little buying interest (in the western hemisphere at least!)”
Well, given buying interest of late, it could well be we have seen the lows. Even though both metals have climbed strongly out of their June lows, there has been very little buying. We’ve had similar reports from others we know in the precious metals markets.
Given the old axiom that bull markets run with the fewest people on board, it is significant we have had such large moves up in price in the face of what is quite limited buying. It seems most aren’t convinced the lows are in. We have to admit even we are sitting on the fence and wondering if we could still see further weakness.
However, we reckon on balance, the lack of buying at the moment could be the telling factor indicating a more lasting bottom is in. The daily RSI’s for both metals have both come back down nicely out of the overbought zone above 70 as well. In the end no one knows for sure and the Fed move next week (taper or no taper) could have an impact in either direction, although perhaps any taper by the Fed is already priced into gold? Our guess is we are close to seeing the intermediate uptrend resume and buying zones around the 50 day moving averages for both metals (NZ$1692.18 for gold and NZ$27.04 for silver) could work out well in the long run.
To see how the Gold Silver Ratio is calculated, how it can be used to determine a good time to buy silver, and where it might head to next see: What is the Gold/Silver Ratio?
To learn more about when to buy gold or silver check out this article: When to Buy Gold or Silver: The Ultimate Guide


Pingback: Gold Wins Regardless | Gold Prices | Gold Investing Guide
Pingback: Gut Reaction on Gold and Silver | Gold Prices | Gold Investing Guide