Prices and Charts
| Looking to sell your gold and silver? | |
|---|---|
| Buying Back 1oz NZ Gold 9999 Purity | $4175 |
| Buying Back 1kg NZ Silver 999 Purity | $1548 |
NZD Gold Hits Another All Time High
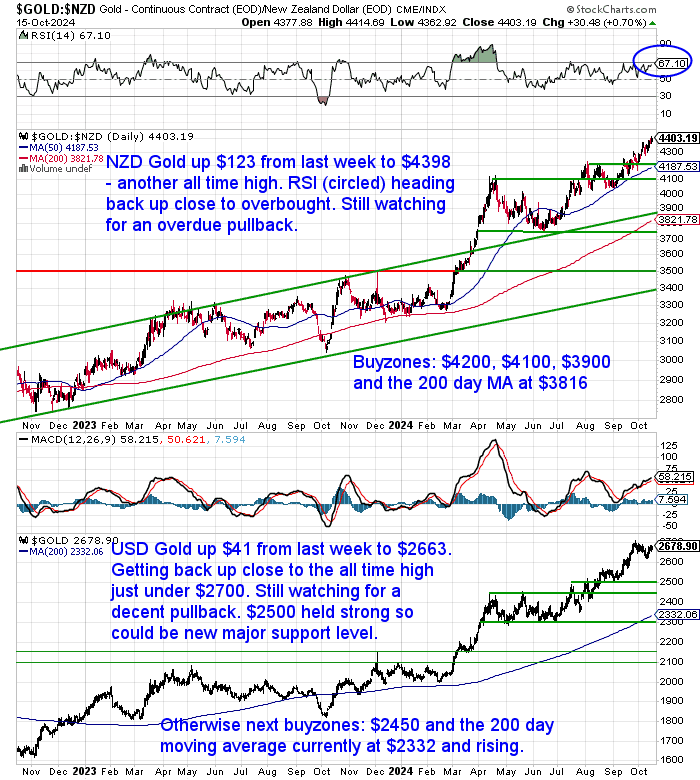
Gold in New Zealand dollars has jumped back sharply this week. Up $123 or 2.9% to hit a new all time high again today. The Relative Strength Index (RSI) is back up close to overbought (above 70). So we are still watching for a decent pullback. If that happens then buy zones are at $4200, $4100, $3900 and then the 200 day moving average (MA) at $3816.
While in USD terms gold was up $41 from last week to $2663. It is getting back close to the recent all time high around $2685. So it was a pretty brief and shallow pullback. Maybe more to come yet? $2500 looks like pretty strong support. With multiple buying zones below that are marked in green in the chart.
NZD Silver up 4%
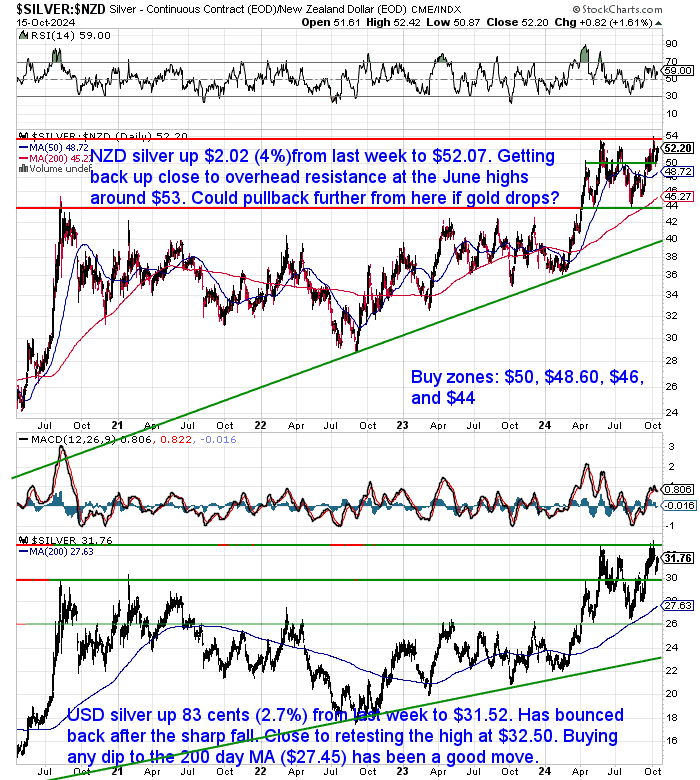
NZD silver bounced back strongly. Up $2.02 from a week ago to $52.07. It is getting back close to the overhead resistance level of the June high around $53. If gold pulls back then silver will follow. Look for buying zones at: $50, $48.60, $46 and $44.
It’s a similar situation in USD Silver. It was up 83 cents (2.7%) to $31.52. Not too far from the overhead resistance line at $32.50. Buying any dip towards the 200 day moving average (currently at $27.63) looks like once again being a good long term move.
Kiwi Dollar Down 1.3% After RBNZ Rate Cut
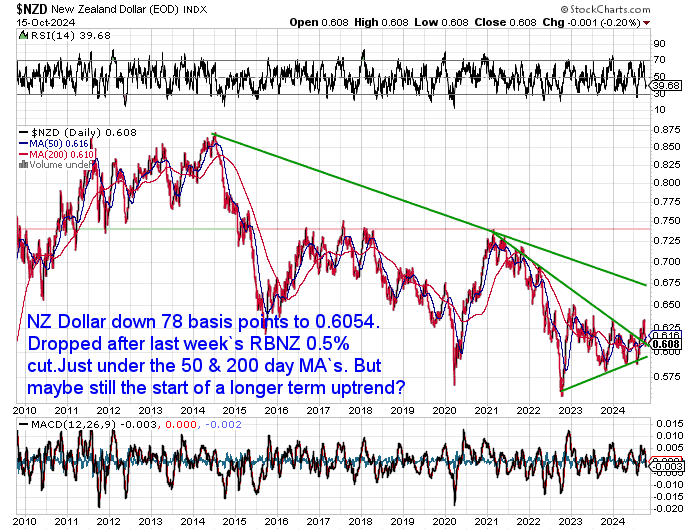
The NZ dollar is down 78 basis points to 0.6054. It dropped sharply after the Reserve Bank cut the Overnight Cash Rate by 0.5% (more on the rate cuts at the end of today’s newsletter). Currently the Kiwi sits just under the 50 and 200 day MAs. But this could still be the start of a longer term uptrend.
Need Help Understanding the Charts?
Check out this post if any of the terms we use when discussing the gold, silver and NZ Dollar charts are unknown to you:
Gold and Silver Technical Analysis: The Ultimate Beginners Guide
Continues below
Long Life Emergency Food – Back in Stock
These easy to carry and store buckets mean you won’t have to worry about the shelves being bare…
Free Shipping NZ Wide*
Get Peace of Mind For Your Family NOW….
—–
Gold Ownership: A Global Survey
In this week’s feature article, we explore the topic of global gold ownership. Ever wondered how many people actually own gold today compared to the past? Or how New Zealand measures up to countries like India and the USA when it comes to private gold holdings?
We uncover some surprising facts about global gold ownership and explain why Western countries, including New Zealand, still show low levels of investment in gold. You’ll see how countries like India treat gold as a key part of their financial lives, while in New Zealand, it’s much less common.
If you’re curious about protecting your wealth, this article sheds light on global trends and what they could mean for you.
Don’t miss out on the full details—check out the article now!
How Many People Own Gold in 2024? New Zealand vs Other Countries
Become a Gold Survival Guide Partner
We offer a lucrative partnership program with access to exclusive marketing materials and ongoing support.
Interested? Contact us today to learn more!
Despite Record Prices Western Gold Demand is Low
It shouldn’t need a spoiler alert for this week’s feature article when we say that gold ownership globally is still very low. Locally here in New Zealand we’re actually seeing more selling than buying.
But Ronni Stoeferle this week pointed how this is not just in NZ:
“Demand from private and professional investors remains very low
Demand for gold remains very subdued among private and professional investors, particularly in North America and Europe. A Bank of America survey of investment advisors in 2023 found that 71% had invested no more than 1% of their portfolio in gold. A further 27% held between 1% and 5%. The significant underweighting of gold is also reflected in the development of global ETF holdings, especially in North America and Europe.
Global ETF stocks have only been increasing again for a few months and, at a total of 3,200 tonnes, are roughly at the same level as before the outbreak of the Covid-19 pandemic but well below the peaks of just under 4,000 tonnes in October 2020 during the pandemic and in March 2022, immediately after the war in Ukraine began.
While ETF demand from Asia has been slightly positive every month in recent quarters, European ETF holdings were only able to turn their long-lasting losses back into positive territory in May. In September, however, outflows predominated again. In the USA, ETF holdings increased for the third month in a row in September, following a rollercoaster ride in the previous quarters in which months with net outflows dominated. ETF holdings, therefore, have a huge amount of catching up to do.
Given the gold price trend in recent quarters, an increase in ETF holdings in North America and Europe from just over 3,200 tonnes to almost 6,000 tonnes would have been expected if one were to base this calculation on the historical correlation since 2005. There is, therefore, still a lot of room for improvement in this demand segment, especially as Western European investors tend to be pro-cyclical.
Thus, it seems that Western investors initially turned down the invitation to the gold party. Now that the party is gaining momentum, they do not want to admit they were party poopers. Therefore, they could only come to this party when it is already in full swing, and then at a much higher “entrance fee”.”
World’s Two Largest Silver Producers Still Down 25% from 2015 Peak
Last week’s feature article on whether silver could one day be worth more than gold, highlighted the issue of peak silver.
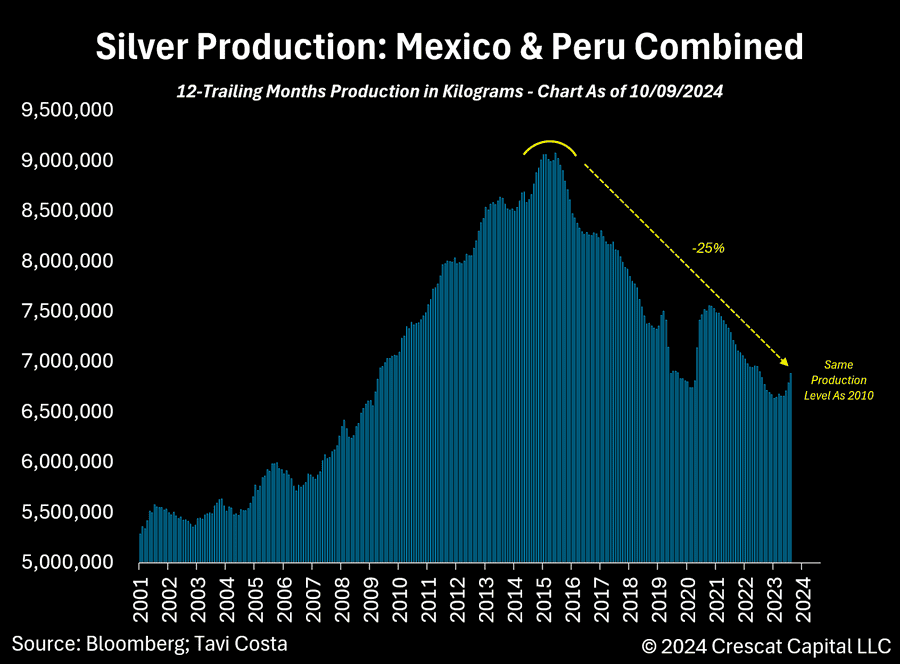
The below chart shows that Mexico and Peru have had a slight uplift in production recently. However they are still 25% down on their 2015 peak:
“Fascinating how despite silver prices being close to their highest levels in 13 years, the production from the world’s two largest producers of the metal has barely changed.
This clearly reflects how constrained new supply remains, and in my view, this is likely to continue given the limited capital being invested in developing new mines.
More importantly:
Silver production is still at the same level it was back in 2010.”
Investment bank UBS just upgraded their gold targets:
UBS loves gold
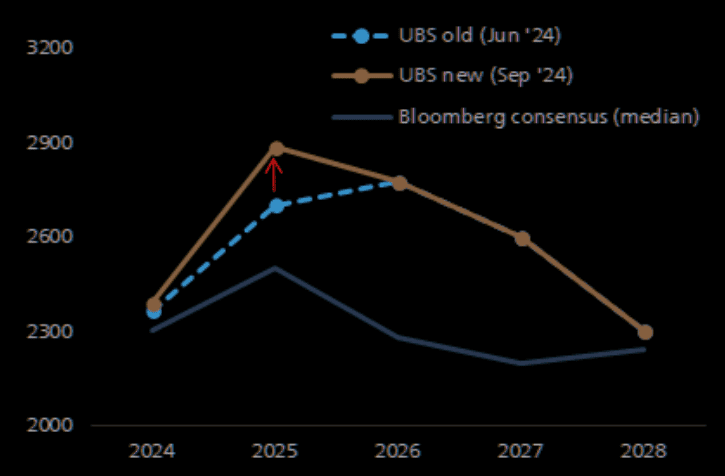
The investment bank upgrades their already bullish view on gold: “We lift our gold price targets, moving them to our previous upside scenario – we now expect the market to rally towards $2800 by year-end and to $3000 in 2025. Gold’s rally this year has been driven by a combination of factors – broad-based buying across the different parts of the market combined with a lack of sellers. We expect these trends to continue.”
The diversifier
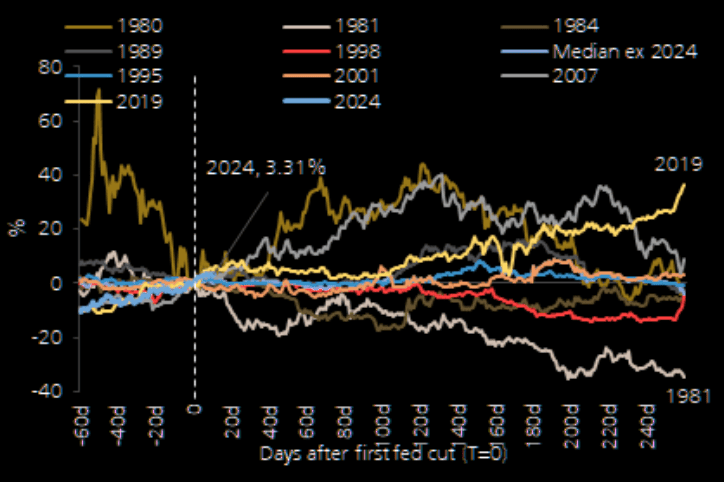
“There is plenty of investor interest to hold gold as a portfolio diversifier in this environment of monetary policy easing not just by the Fed, but by other central banks as well. Now that the Fed’s easing cycle is underway, we expect investors to start increasing gold positions as the cost of carry continues to decline. Although part of gold’s strength this year reflected the anticipation of Fed easing, we expect the market to continue its uptrend as the cutting cycle continues. Historically, gold gained on average over the next 3 quarters after the first Fed cut.” (UBS).
However, to us a positive is that UBS then predicts gold to fall each year through to 2028. In the current environment it’s far more likely gold will rise over the next 3 years. So the fact the investment banks don’t believe this is also a good contrarian indicator for the long term gold price.
Central Bank’s Tightrope Walk: Cutting Short Rates While Inflation Looms
As UBS points out, the Fed has started its rate cutting cycle. However something is happening that most wouldn’t have expected:
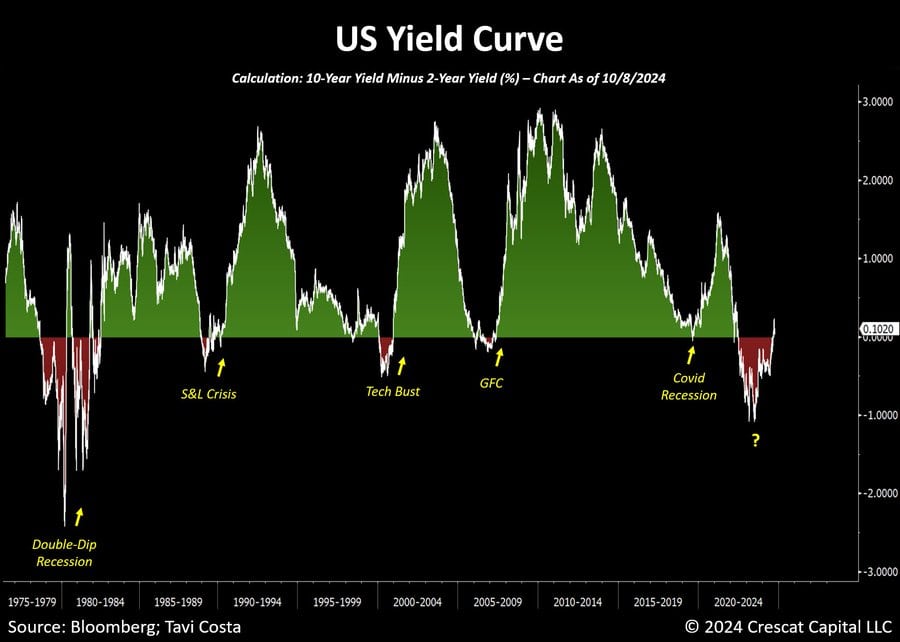
“Short-term yields are falling while long-term interest rates and inflation expectations are on the rise once again.
This reflects a Federal Reserve that is cornered, needing to suppress short-term rates to alleviate the government’s debt servicing costs, while potentially allowing inflation to run higher and pushing up long-term rates, in our view.
We believe this combination is likely to create the ideal conditions for a much further steepening of the yield curve.
How can this happen? Because it is the markets that control long term interest rates, not central banks. Higher long term rates indicate that investors expect higher inflation in the longer term and so want higher interest rates to make up for this risk.
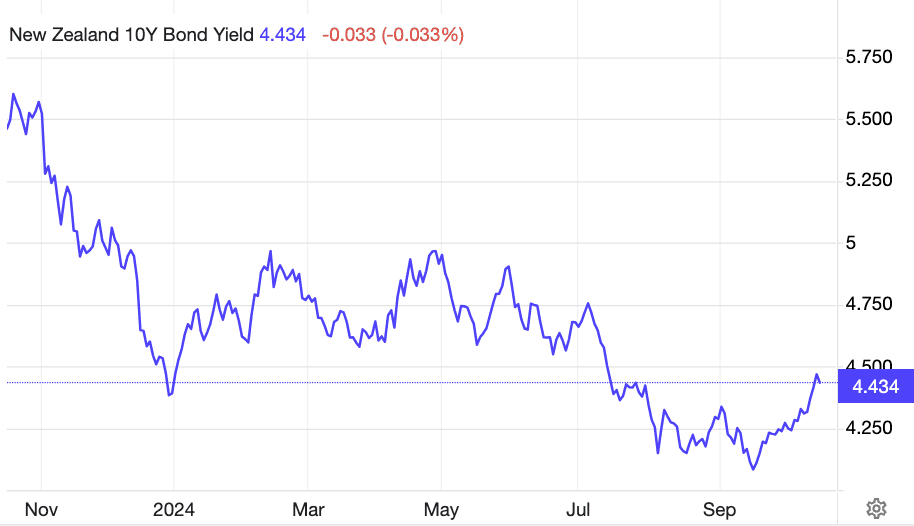
The same thing is happening here in New Zealand. The central bank last week cut interest rates by 0.5%. But the NZ 10 year government bond yield has been rising since mid September. Both here and in the USA long term rates have risen by almost as much as both central banks have cut the short term.
We stick to our thesis that higher inflation is still to come down the track. Be sure you’re prepared for the ongoing devaluation of fiat currency. Safe & Effective Roadshow
If you’re in Wellington or the South Island in November, you may be interested in the “Safe & Effective” Roadshow for which a friend of ours, Natalie, is the MC.A Quest for Common Sense, Compassion & Justice ~ Searching for truth, impacts & solutions around the New Zealand COVID Response.
Please get in contact for a gold or silver quote, or if you have any questions:
- Email: orders@goldsurvivalguide.co.nz
- Phone: 0800 888 GOLD ( 0800 888 465 ) (or +64 9 2813898)
- or Shop Online with indicative pricing
This Weeks Articles:
How Many People Own Gold in 2024? New Zealand vs Other Countries
Tue, 15 Oct 2024 6:18 PM NZST

How many people own gold? How does that number today compare to what it was historically? A reader asks: “I […]
The post How Many People Own Gold in 2024? New Zealand vs Other Countries appeared first on Gold Survival Guide.
Read More…
As always we are happy to answer any questions you have about buying gold or silver. In fact, we encourage them, as it often gives us something to write about. So if you have any get in touch.
- Email: orders@goldsurvivalguide.co.nz
- Phone: 0800 888 GOLD ( 0800 888 465 ) (or +64 9 2813898)
- or Online order form with indicative pricing
7 Reasons to Buy Gold & Silver via GoldSurvivalGuide
Today’s Prices to Buy
Tube of 25: $1554.55 (pick up price – dispatched in 2 weeks)
Box of 500 coins (dispatched in 4 weeks):
2024 coins: $29,585.87
Backdated coins: $29,379.57
Including shipping/insurance (4 weeks delivery)
Can’t Get Enough of Gold Survival Guide?
If once a week isn’t enough sign up to get daily price alerts every weekday around 9am Click here for more info
We look forward to hearing from you soon. Have a golden week!
David (and Glenn)
GoldSurvivalGuide.co.nz
Ph: 0800 888 465
From outside NZ: +64 9 281 3898
email: orders@goldsurvivalguide.co.nz
The Legal stuff – Disclaimer:
We are not financial advisors, accountants or lawyers. Any information we provide is not intended as investment or financial advice. It is merely information based upon our own experiences. The information we discuss is of a general nature and should merely be used as a place to start your own research and you definitely should conduct your own due diligence. You should seek professional investment or financial advice before making any decisions.
Copyright © 2024 Gold Survival Guide.
All Rights Reserved.


