
This Week:
- Why is the Gold/Silver Ratio at New Highs?
- NZ Dollar Holding Pattern?
- Early Signs of the War on Cash Down Under?
- Confirmation – World Trade Slumps
- China: More Troubles to Come and impact on NZ
|
Special Today
1oz NZ Mint 99.99% Gold Kiwi Ph 0800 888 465 and speak to David or reply to this email. |

Prices and Charts
| Spot Price Today / oz | Weekly Change ($) | Weekly Change (%) | |
|---|---|---|---|
| NZD Gold | $1861.90 | + $13.97 | + 0.75% |
| USD Gold | $1240.58 | + $10.78 | + 0.87% |
| NZD Silver | $22.45 | – $0.47 | – 2.05% |
| USD Silver | $14.96 | – $0.29 | – 1.90% |
| NZD/USD | 0.6663 | + 0.0008 | + 0.12% |
We’ve seen gold move higher again this week. It headed up towards February’s NZ$1900 high, but has since dropped back to hold above the NZ$1850 mark. Gold just doesn’t seem to want to fall too far at the moment. We still favour the scenario of another move higher from here over a decent sized pull back. But we will have to wait and see.

Meanwhile silver has dropped back this week to be below the 200 day moving average. It is down into neutral territory on the RSI overbought/oversold indicator. NZ$24.50 is the key level we need to see it get above. Something it hasn’t managed to do over the past year or so.
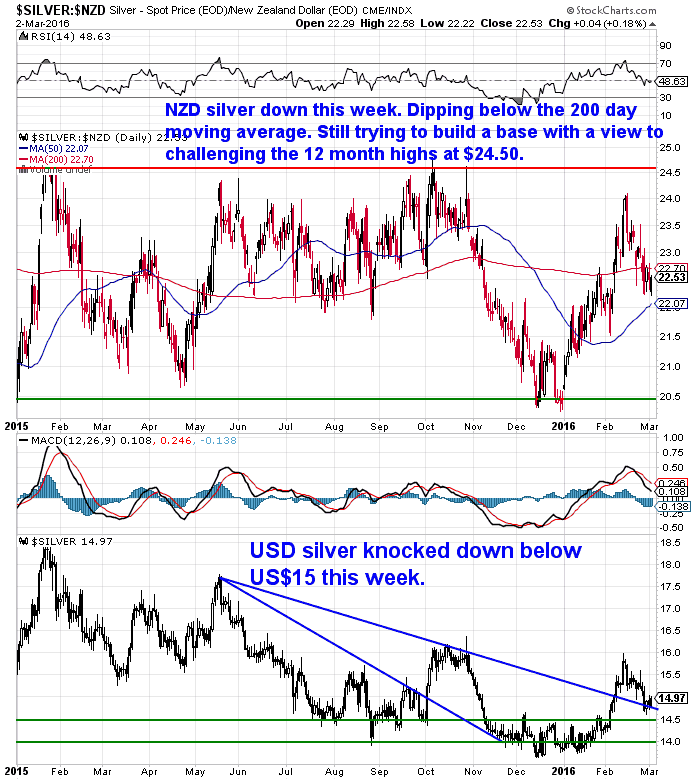
So silver continues to lag gold. This is clearly evident in the gold to silver ratio blowing out to a new high above 80. This is a significant event so we’ve written a full article on it this week.
 In this look at the Gold to Silver Ratio we cover:
- What is the Gold/Silver Ratio?
- How is the Gold/Silver Ratio used?
- What is the Ratio telling us now?
- Two points of view on what a new high in the gold to silver ratio may mean.
- What do we think about the ratio right now?
- What to do?
Why is the Gold/Silver Ratio at New Highs?
NZ Dollar Holding Pattern?
The NZ dollar is sitting right on the downtrend line from the mid 2014 high. Also of note in the chart below is that the 200 day and 50 day moving averages are converging. Plus they are lining up with the downtrend line. So that will make for some tough resistance for it to break through.
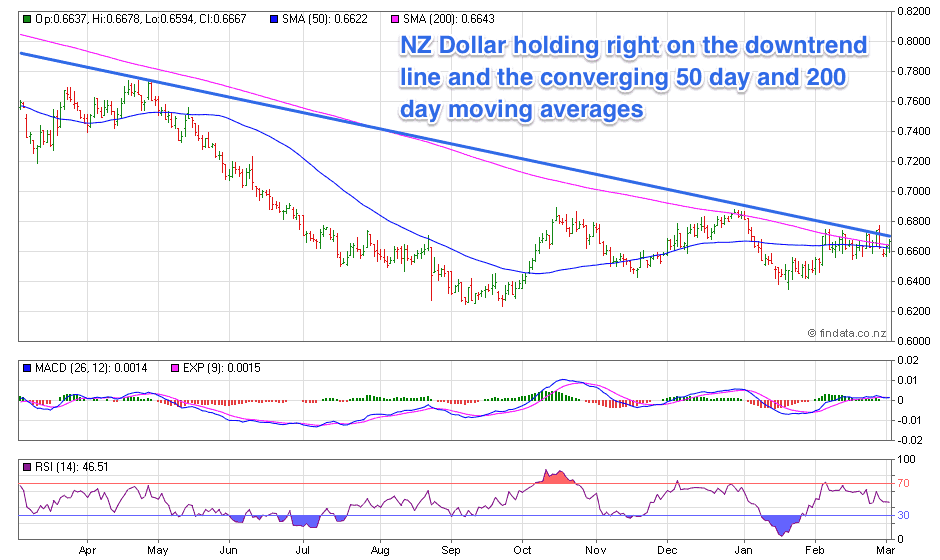
So perhaps we will see the Kiwi continue to trade in the 0.64 to 0.69 range it has been in for the last 6 months? This would fit in with our “guess” at the start of the year that the Kiwi dollar might strengthen slightly against the USD over the course of the year, but not by much.
So far this year it’s actually been slightly the opposite. The NZD has weakened slightly against the USD year to date. With the prices of gold and silver having the most impact upon NZ precious metals prices rather than it being the NZ dollar.
Year to date figures are:
- NZD Gold up 20%
- USD Gold up 17%
- NZD silver up 11%
- USD silver up 8.5%
So only a small difference in price movements between the prices in both currencies, means not much movement in the NZD/USD cross rate.
Early Signs of the War on Cash Down Under?
Tony Richards, head of the Reserve Bank of Australia’s payments policy department, has discussed the possibility of the RBA issuing digital only currency.
Reserve Bank says Australian dollars could come in digital form in future
“It is entirely possible that Australian dollars will come in digital form in the future, breaking the link entirely between material notes and coins, the Reserve Bank says.
In a speech where he also flagged the end of the cheque, Mr Richards said the RBA had been watching the growth in demand for privately-established virtual currencies like Bitcoin, and believed there was a place for a central-bank-issued digital currency in Australia.
It thinks digital dollars will one day circulate in parallel with old fashioned banknotes and other existing forms of our national currency.”
“…the central bank is not “actively” considering introducing a digital currency in Australia yet, but it’s possible authorities the bank will produce and distribute such a currency in the future.
“A plausible model would be that issuance would be by the central bank, with distribution and transaction verification by authorised entities, which might or might not include existing financial institutions,” Mr Richards said.”
So while it’s not here yet, a completely digital currency is being talked about across the ditch too. Just like it has recently by the central banks of England, Canada and China.
This is how these changes are initially floated with just a mention here and there. But they are signs of where the central planners want to take us.
Another sign in Aussie perhaps is the below headline:
ANZ Bank hires Google Australia boss as head of digital
The new head aims to “position the bank closer to its increasingly digital customer base, noting a cultural transformation as well as structural one will be a big part of the this change.”
An earlier article noted that the role:
“…will take control of the bank’s digital customer solutions, including its long-awaited mobile wallet, which is expected to launch early this year. ANZ spends around $1.2 billion each year on technology initiatives.”
So the head of “Big Data” in Australia is to be the head of digital at a “Big Bank”. Another step closer to digital currencies too perhaps?
Preparation also means having basic supplies on hand.
Are you prepared for when the shelves are bare?

For just $265 you can have 1 months long life emergency food supply.
Learn More.
—–
Confirmation – World Trade Slumps
“The exporting countries are not obtaining excess funds (from their exports over their imports) with which to purchase Government Bonds for Reserves. On the contrary, a flight of Capital from the exporting countries to the Reserve issuing countries is taking place, and the Central Banks of the exporting countries are selling off their Reserves, to provide funds for the Capital flight.”
and also: Hugo Salinas Price – Gold Repriced at End of Contraction PhaseMore evidence of this global trade slow down emerged this week. From Bill Bonner:
Trade Slump
“It came out last week that world trade did indeed fall in 2015. It was the first time this had happened since 2009.
Starting at the end of last year, we began following the trains, trucks, ships, and sales of “yellow machines” – backhoes, loaders, bulldozers, etc. – and watching them all slow down.
Sure enough, they were telling us something important. Reports the Financial Times:
“The value of goods that crossed international borders last year fell 14% in dollar terms.”
Most notably, a decline in world trade means China is not exporting as much merchandise as before. This, we guessed, would mean a greater outflow of foreign exchange reserves from China’s central bank… and make it more difficult for it to prop up the exchange value of the renminbi.
(A country accumulates foreign exchange reserves when it exports more than it imports. In the case of China, dollars, euro, etc… flow into the country in exchange for Chinese-made goods. This foreign currency builds up as reserves at the central bank. It can then dip into this stash to buy its own currency and prop up its value.)
The Chinese government denied it. And it warned billionaire speculator George Soros not to short the renminbi. But as in the old Soviet days, no rumor is confirmed until it is officially denied.
And sure enough, yesterday’s Financial Times brought news that the renminbi was slipping:
“This morning, the People’s Bank of China [China’s central bank] set the reference rate for the renminbi, around which the currency is allowed to trade, weaker by 0.17% and lower for a fifth straight session.
It was both the equal-largest depreciation and longest streak since the first week of January, when the currency’s movements spurred heightened volatility in global financial markets.
The renminbi’s weakness comes despite comments from Zhou Xiaochuan, the PBoC’s governor, at the start of the G20 finance ministers and central bankers meeting last Friday that there is “no basis for persistent renminbi deterioration.”
China: More Troubles to Come
The Daily Bell is certainly not at all positive on China at the moment either:
“It is China, after all, that holds the economic fate of the world in its hands. It is China that is fueling a lot of the international buying of real-estate, commodities and even consumer goods.
The US is supposedly headed back into recession and Europe never left. China is the biggest factor in world economic growth.
If China falls, so does the world. That’s why the Western mainstream media never reports the deepest and darkest truths about China.
But gradually China’s intractable troubles are showing themselves in ways that cannot be denied.
China’s stock markets have crashed repeatedly, and its growth slowed again in 2015 and is predicted to slow once more in 2016. Latin American trade, which has been substantive, has slumped by astonishing 50 percent. Trade with Brazil is down 60 percent!
But these sorts of statistics are still not as popular as the “Chinese miracle” theme. They are not being broadcast fully, even at a time when Western media is grappling with a stream of bad Chinese news.”
They also quote some excerpts from David Stockman:
“China is on the cusp of the greatest margin call in history. Once asset values start falling, its pyramids of debt will stand exposed to withering performance failures and melt-downs. Undoubtedly the regime will struggle to keep its printing press prosperity alive for another month or quarter, but the fractures are now gathering everywhere because the credit rampage has been too extreme and hideous. Maybe Zhejiang Xingrun Real Estate which went belly up last week is the final catalyst, but if not there are thousands more to come.
Like Mao’s gun barrel, the printing press has a “sell by” date, too”
Increased violence lurks just behind the façade of China’s success. As China’s financial situation grows more perilous, the central government will surely begin a process of blaming individual citizens – investors, industrialists and speculators – for the deteriorating economic environment.
In fact, from various reports, we can see this has already begun. If one believes that China is going to stabilize itself, one must also believe that the Chinese government is going to be able to turn the many millions that comprise China’s newly formed middle classes into “consumers.”
The idea, then, is that these Chinese should begin to mimic US consumer society. Yet surely some of these Chinese are related to individuals who only 60 years ago were being imprisoned for revealing Western influences in their thoughts or clothing.
Conclusion: No doubt, the pro-China propaganda of the past 20 years has enmeshed numerous Westerners in Chinese society and its economy. If you are one of them, you ought to be having second thoughts. If you can’t extricate yourself, at least try to reduce your exposure. And if you have none, keep it that way.
The Impact on New Zealand
As we’ve noted for a while the China slow-down has most noticeably impacted the NZ dairy sector.
Now a New york based expert has said the dairy industry’s woes a long way from over yet.
“A series of “tectonic shifts” in the global dairy market are going to keep New Zealand export prices down for some time, a New York-based expert has told industry leaders. Speaking to a Federated Farmers dairy and sharemilkers’ council meeting in Nelson, Rabobank’s dairy analyst, Thomas Bailey, who previously had four years with Fonterra, said there had been five big changes.”
These were:
- A huge increase in European milk production had caught New Zealand off guard
- New Zealand, with 30 per cent of the global dairy export trade, had suffered large market losses in its “big-demand markets”, China and Russia.
- The prices of oil and dairy exports were closely related, with many big oil producers being large importers. If oil prices stayed down the market could be depressed for years.
- While historically when New Zealand dairy production went down, global prices rose. This year prices didn’t respond like that.
- A US renaissance in dairy was centred on fresh products that New Zealand wasn’t supplying.
This in turn has seen Fonterra also slip deeper into debt with an article from Brian Gaynor noting that Fonterra’s total borrowings are now more than $7.5 billion. Up from $4.65 billion in 2011!
“While its net positive cash/overdraft position has deteriorated from $762 million to $303 million over the same period.”
[Primary Industries Minister Nathan Guy also stated that] “dairy farming debt was drifting into a “severe scenario” and he would be urging banks to stand by farmers. The Minister observed that the latest Reserve Bank statistics showed dairy farm debt now stood at $37.9 billion, compared with $30 billion five years ago.”Here’s what else we learn.
Fonterra has a market value of $8.9 billion. But its total borrowings are $7.56 billion. This debt to market cap ratio is massively greater than the 3 largest listed NZ companies.
So Fonterra has less cash, more debt and is issuing more bonds and increased its bank loans.
A higher credit rating means you can pay lower interest rates to banks and bond holders. To maintain the current rating it could reduce its farmgate milk price – i.e. what it pays farmers. Thereby increasing cashflow.
However if they do this it could “put some of its loans to farmers at risk.” Hello rock, meet hard place. Pay farmers even less, risk more of them going broke. Pay farmers more, put fonterras finances at risk instead.
So finally a realisation is arriving that dairy prices could remain low for years yet.
So could other commodities. However it seems gold is beginning to decouple from the broader commodities complex as noted today in Bill Bonner’s Diary
“Gold and commodities are diverging.
As you can see from today’s chart, gold bullion is up 15% so far in 2016.
That compares with a 2% loss for the Bloomberg Commodity Index… an 8% loss for U.S. crude oil… and a 27% loss for natural gas.
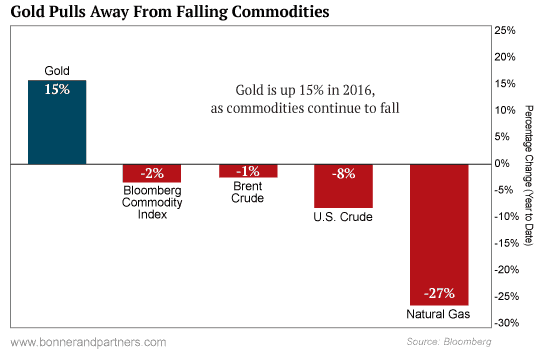
Gold is finally breaking free of the drag of falling commodities prices – a bullish omen for the metal.”
If you want to take a position in the metals that have no counterparty risk then get in touch.
Free delivery anywhere in New Zealand and Australia
A monster box of 500 x 1oz Canadian Silver Maples delivered to your door via UPS, fully insured is $13,950 and delivery is now about 7-10 business days.
— Prepared for Power Cuts? —
[New] Inflatable Solar Air Lantern

Check out this cool new survival gadget.
It’s easy to use. Just charge it in the sun. Inflate it. And light up a room.
6-12 hours of backup light from a single charge! No batteries, no wires, no hassle. And at only 1 inch tall when deflated, it stores easily in your car or survival kit.
Plus, it’s waterproof so you can use it in the water.
See 6 more uses for the amazing Solar Air Lantern.
This Weeks Articles:
|
|||||||||||||||||||||||||
|
|||||||||||||||||||||||||
|
|||||||||||||||||||||||||
|
|||||||||||||||||||||||||
Unsubscribe | Report Abuse
|