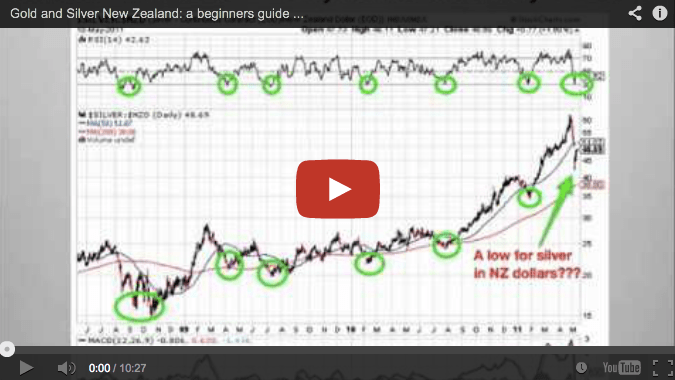
Here’s our latest video – a beginners guide to technical analysis of gold and silver in New Zealand dollars.
In it we look at 2 simple technical analysis indicators that can be used to help determine lower risk entry points when buying gold and silver in New Zealand. The video covers the Relative Strength Index or RSI and the 200 day moving average (MA).
If you prefer to read than watch, then here’s the link to the article version of the video instead:
NZ Dollar Gold and Silver: A Beginners Guide to Technical Analysis
For more on technical analysis see this related article: Gold and Silver Technical Analysis: The Ultimate Beginners Guide


Pingback: Gold not liquid enough for the RBNZ | Gold Prices | Gold Investing Guide
Pingback: Pub logic: Why gold is (not) in a bubble | Gold Prices | Gold Investing Guide
Pingback: Buying Precious Metals: Common Questions from First Time Buyers | Gold Prices | Gold Investing Guide
Pingback: Gold Prices | Gold Investing Guide Why Use Technical Analysis if Gold & Silver are Manipulated?
Pingback: Beginners guide to technical analysis - Gold Prices | Gold Investing Guide
Pingback: NZD Gold and Silver: A Beginners Guide to Technical Analysis