Personally we believe using technical analysis in isolation is of limited value. When markets are being flooded with printed money they won’t necessarily follow historical trends, which, in its simplest form is basically what technical analysis is. However, used in conjunction with other indicators and fundamental analysis, technical analysis has its place. Say you’ve done your homework and as a result believe that precious metals are in a long-term bull market. (Looking to see whether any of the indicators in this article have come about may be useful in assessing this: https://goldsurvivalguide.co.nz/when-will-you-know-its-time-to-sell-gold/). Technical analysis may then be useful in helping to determine a good initial entry point. The easiest way to explain a few useful bits of technical analysis for gold and silver is to actually do some – analysis that is. We’ll look at a couple of simple to follow indicators:
- 200 day moving average (MA). (Here’s the definition from investopedia: http://www.investopedia.com/terms/m/movingaverage.asp)
- Relative Strength Index (RSI) (and the definition from wikipedia: http://en.wikipedia.org/wiki/Relative_Strength_Index)
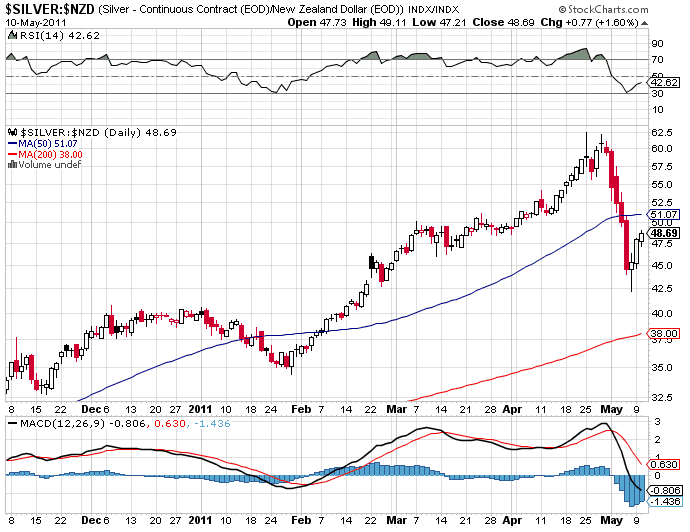
So let’s turn our eye to the current NZ dollar charts for gold and silver. First up silver.
The price has gone from well above the 50 day moving average (MA) (blue line) to now well below. In fact we were only about $4 from the 200 day MA (red line), which as we’ve mentioned before is often an area where the price for gold and silver finds “support” and bottoms. At the top of the chart is the RSI – basically an indicator of over bought (70 and above) or oversold (30 and below). Silver can stay over bought for long periods of time however. On this chart you can see it was in or around overbought territory for close to 2 months until the sell-off. So in a matter of days we went from one extreme to the other. You can see that when the RSI touched 30 three days ago, the price reversed and started to climb. Now on to a longer term chart of NZD silver over 3 years.
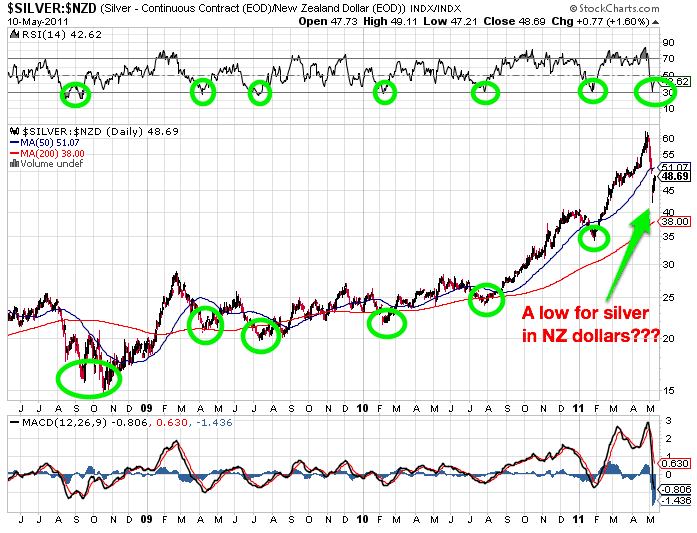
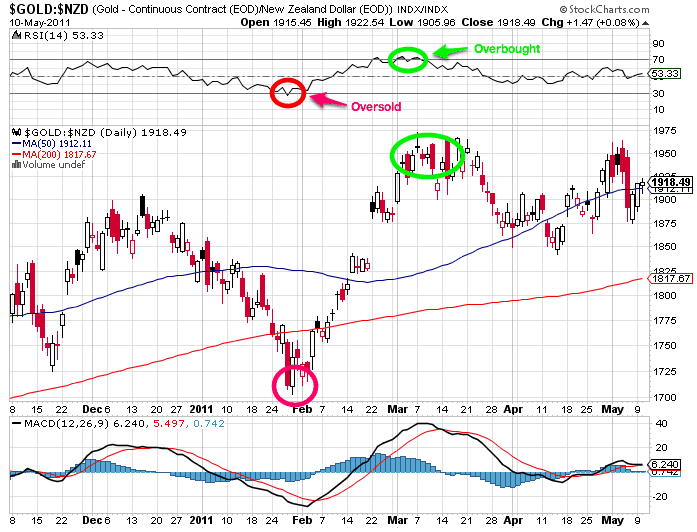
Notice that whenever the RSI hits 30 (indicated by the green circles at the top of the chart) this generally coincided with the silver price also bottoming out (the green circles within the chart). Was it 100%? Nope. You can see that in mid August 2008 the RSI went below 30 and the price turned up. But then the RSI and price both went lower again. The silver price didn’t bottom until October, 2 months later and some $3-4 lower. But the point is that buying on an oversold RSI within the confines of a bull market can generally make for a good entry position in the longer term. On this chart you’ll also notice that, apart from mid to late 2008, the price generally found support at or not far below the 200 day MA (red line). So this is another useful indicator to keep an eye on in terms of potential buying opportunities. For gold we can take note of the same indicators. The RSI indicator also often indicates a bottoming of the NZ dollar gold price as shown in the chart below.
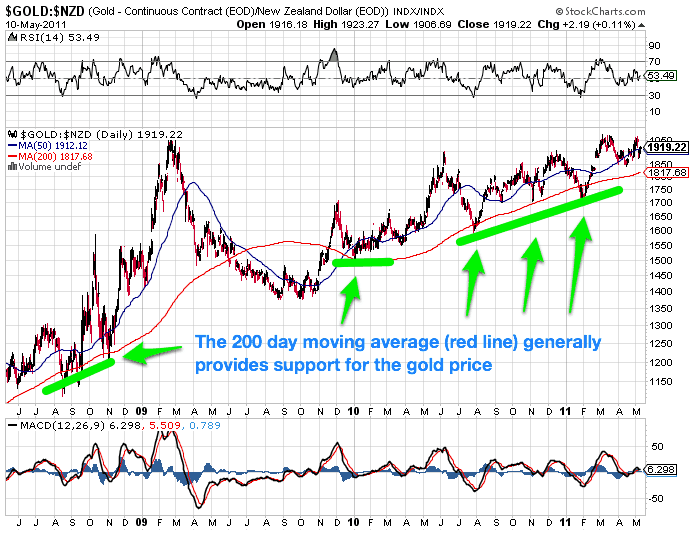
And the 200 day MA historically has shown support for the price of gold.
Of course there are exceptions. As you can see above, in mid 2009 the price fell well below the 200 day MA and stayed there for 4 months. However since then it has only briefly dipped below the “red line”. So if you’re in for the “long haul”, then using some simple technical indicators like these two can be useful in determining lower risk entry points. Just remember they’re not fool proof, which is why it’s worth considering “averaging in”. That is buying in “tranches” close to your buying zone. So once the price has dipped consider taking an initial position and then buying more regularly after this. P.S. If you’d like to recreate the above charts for yourself from time to time, just go to stockcharts.com and enter in $GOLD:$NZD or $SILVER:$NZD. Read more on this topic:
A beginners video guide to technical analysis >>
Reader Question: “Why Bother With Technical Analysis if Gold & Silver are Manipulated?” >>Gold and Silver Technical Analysis: The Ultimate Beginners GuideTo learn more about when to buy gold and silver see this article: When to Buy Gold or Silver: The Ultimate Guide


Pingback: Gold and Silver New Zealand: A beginners guide to technical analysis | Gold Investing Guide
Pingback: Gold not liquid enough for the RBNZ | Gold Prices | Gold Investing Guide
Pingback: Beginners guide to technical analysis - Gold Prices | Gold Investing Guide
Pingback: Why Use Technical Analysis if Gold & Silver are Manipulated?