Prices and Charts
USD Gold Hits Another New All-Time
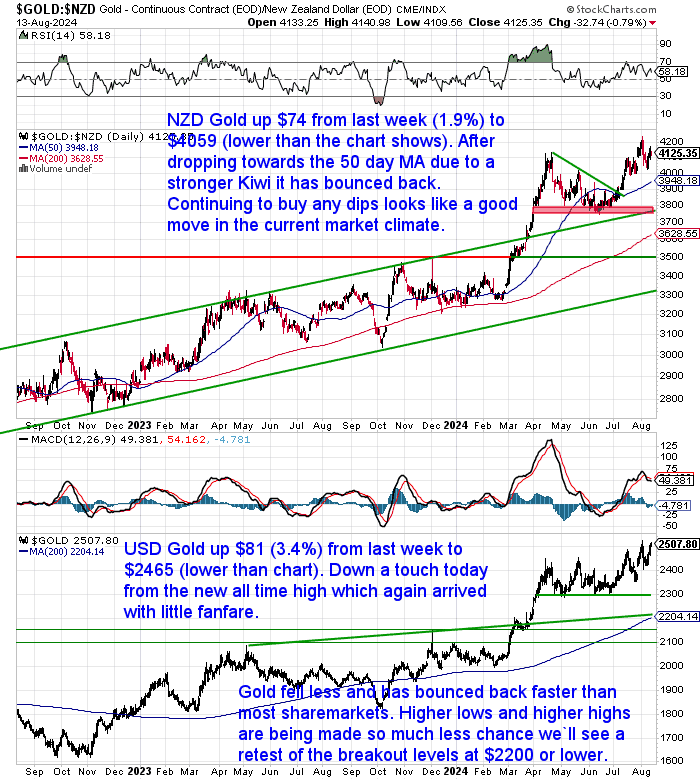
Gold in New Zealand dollars was up $74 or just under 2% from last week to $4059. After the stronger Kiwi forced NZD gold down towards the 50-day moving average (MA), it has bounced back up. (Note: It dropped lower than the chart shows and is also lower now than the chart depicts). It is looking like a higher low has been made, so probably a good idea to buy any dips.
While in USD gold actually hit another all-time high this week. Again we heard… crickets. As pretty much no one noticed. Today it is down a little but still up $81 (3.4%) from last week to $2465 (also lower than the chart shows).
So what we said last week seems to have happened. Gold didn’t fall as much as stocks did and it has bounced back faster. So we’d reiterate last week’s comments that any dips look like buying opportunities.
Silver Also Bouncing Back
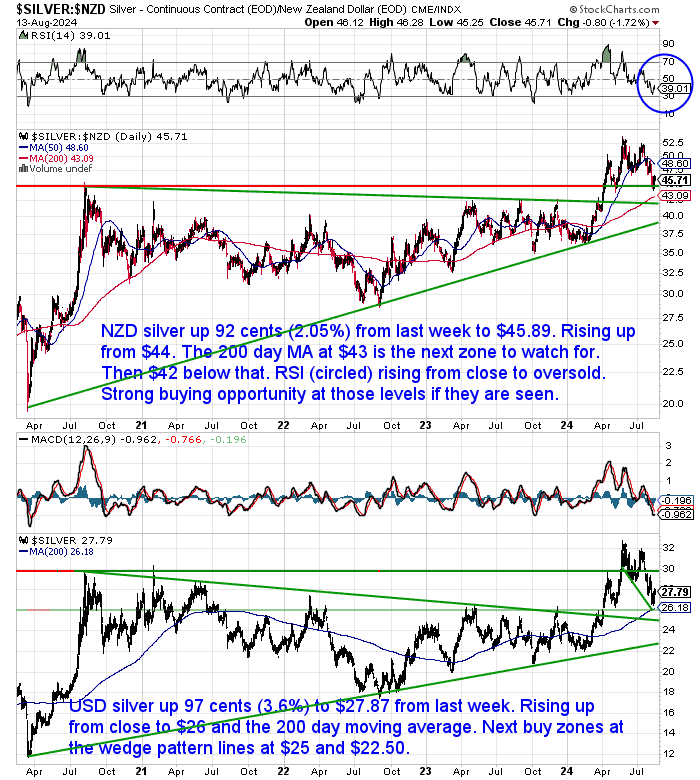
NZD silver is up 92 cents (2%) from last week to $45.89 today. It bounced up from $44 after getting down close to the 200-day moving average (MA). Any further dips down to there or $42 look like being great buying opportunities. We are likely close to a bottom in silver with the downside being at most $39.
In USD terms, silver did pretty much reach the 200-day MA before bouncing sharply. It is up 97 cents or 3.6% from 7 days ago. If it dropped any lower the next buy zones would be $25 and $22.50.
Kiwi Dollar up 1.5%
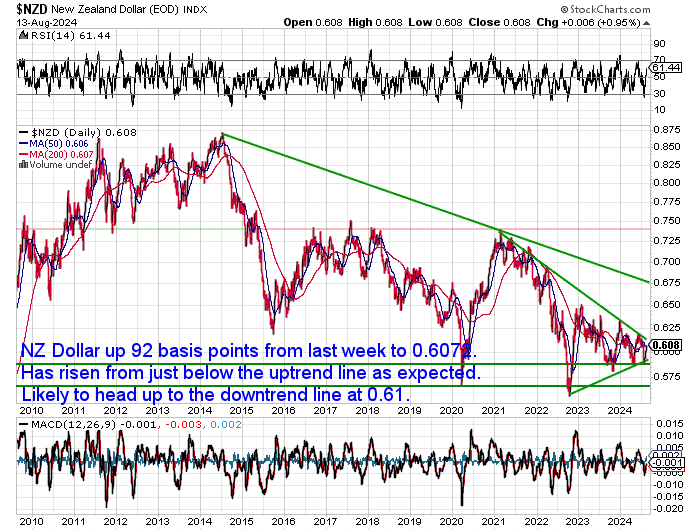
The Kiwi dollar was up 92 basis points or a hefty 1.5% from last week. As we’ve been saying it looks like it is heading up to test 0.6100 and the green downtrend line. Perhaps it will break that and head even higher? But with both the NZ and USD central banks likely to cut interest rates soon, it will be a case of who is the prettiest horse in the glue factory. i.e. which one loses the least value.
Need Help Understanding the Charts?
Check out this post if any of the terms we use when discussing the gold, silver and NZ Dollar charts are unknown to you:
Continues below
—– OFFER FROM OUR SISTER COMPANY: Emergency Food NZ —–
Long Life Emergency Food – Back in Stock

These easy-to-carry and store buckets mean you won’t have to worry about the shelves being bare…
Free Shipping NZ Wide*
Get Peace of Mind For Your Family NOW….
—–
Stocks vs. Gold: A 100-Year Dance – Who’s the Better Investment?
Gold and stocks have been investment staples for centuries, but how do they stack up against each other? With the recent plunge in Japanese and global stock markets, we thought it was timely to compare stocks and gold. So this week’s feature article explores the relationship between these two asset classes over the past 100 years.
The article covers:
- How the Dow Gold Ratio reflects the relative performance of stocks and gold over time
- Major historical trends in the ratio, revealed periods where stocks or gold shined brighter
- Whether the current ratio offers any clues about future investment opportunities
Intrigued by the historical dance between stocks and gold, and curious about which one might be a better fit for your portfolio in today’s market? This article unpacks the data and provides valuable insights to help you make informed investment decisions.
Become a Gold Survival Guide Partner
Are you a business owner, blogger, or influencer with an audience interested in gold, silver, and financial preparedness? Partner with Gold Survival Guide and earn commission by referring customers our way!
We offer a lucrative partnership program with access to exclusive marketing materials and ongoing support.
Interested? Contact us today to learn more!
Gold Survival Guide Q&A Call Recording: Analysing the Silver Breakout
In case you missed our recent Q&A call there is a recording available.
The theme was: “Analysing the silver breakout”.
We delved into various charts and looked at:
- Why this current breakout in silver is so significant
- What levels to look for as possible buying zones in the current consolidation or pullback
- Some potential price targets to look towards in the future
- Timing for these targets
- Plus we answered over 30 questions from our readers
Tavi Costa: Gold on Brink Of Breakout vs NASDAQ
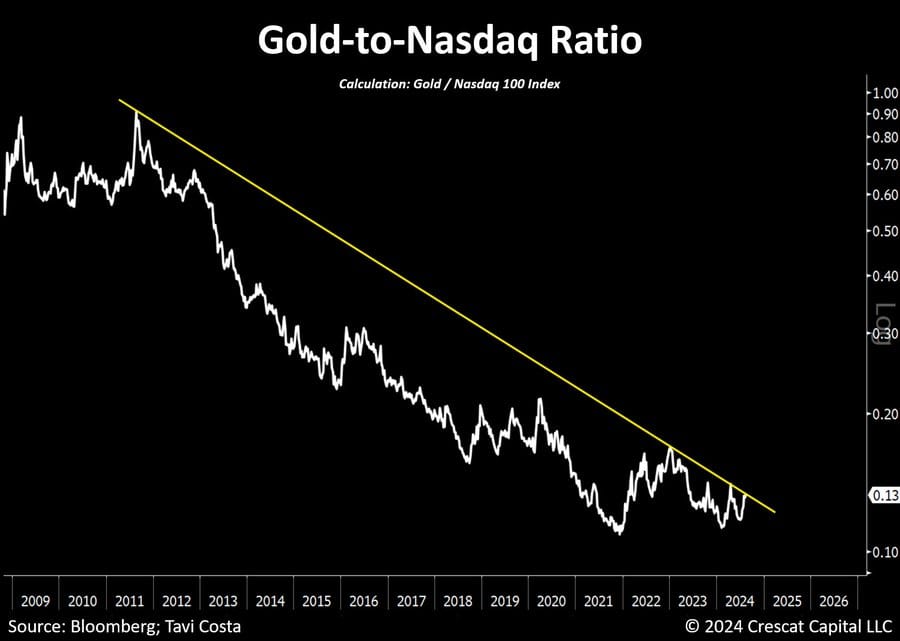
After publishing this week’s feature article this related post from Tavi Costa popped up in our twitter/X feed. He is looking at the ratio between gold and the US NASDAQ stock exchange, rather than the Dow Jones Industrial Average Index we used. However, the conclusion is similar:
“Gold prices closed at record levels today, but what’s even more significant:
The gold-to-Nasdaq ratio is currently on the brink of breaking out from a historical resistance.
Here is a reminder that this ratio surged 13x from the peak of the tech bubble in 2000 to 2011.
History doesn’t repeat itself, but it often rhymes.
Additionally:
One of the most consistently successful investment strategies following over 70% of Treasury curve inversions since 1970 was to go long the gold-to-S&P 500 ratio for the subsequent 24 months, regardless of whether the period was inflationary or deflationary.
Source.
Just note that Tavi’s ratio is inverted so it is gold over stocks not the other way around. So while his chart looks like it is breaking up, ours looks like it is breaking down as it is stocks over gold.
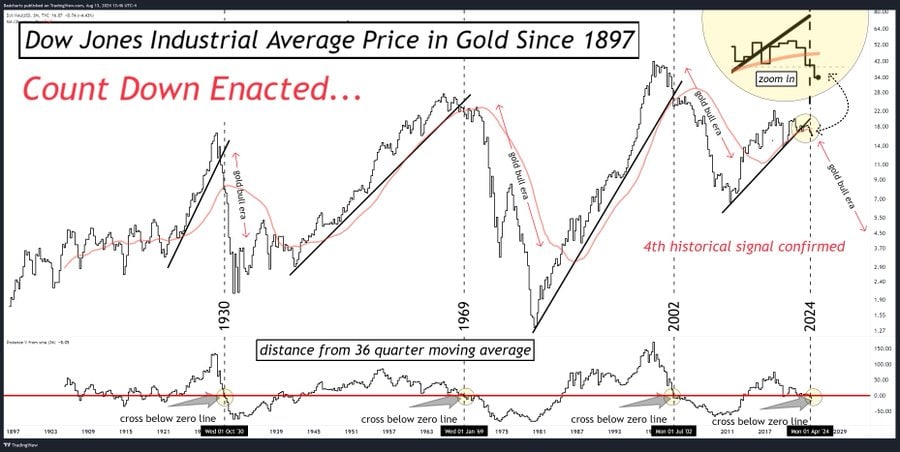
But here’s a similar chart to ours that clearly shows stocks breaking down versus gold
Dow jones Industrial Average Priced In Gold.
Only the 4th time this has happened in over 100 years.
Only the 3rd time since gold was unpegged back in 1971.
US stocks are very close to properly imploding priced in gold.
#gold #dowjones #stocks #silver
Source.
Another All-Time High in Gold Goes Unnoticed
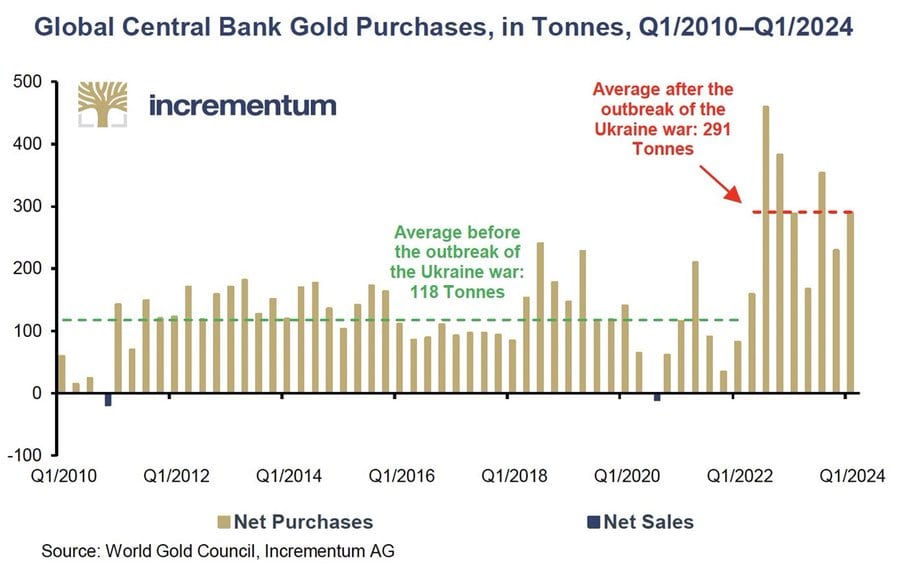
The USD gold price hit another all-time high this week. Yet again no one noticed. Those that did instead pointed out that higher prices will likely dampen demand. However Tavi Costa points out why central banks are continuing to buy gold at heightened levels regardless of the price:
“It’s intriguing to see articles suggesting that today’s gold prices might soon dampen demand, while central banks continue to report purchases well above historical averages.
This perspective either fails to recognize the significant political constraints facing central banks or deliberately ignores them to attract attention.
The BOJ can barely manage a 0.25% rate hike without causing turmoil in the financial markets and being forced to immediately reassure that rates will remain stable.
Meanwhile, the ECB is cutting rates, and the Fed has no choice but to adopt a similar position, given that the US is currently experiencing the highest interest payments to GDP in two centuries.
Despite this situation, investors continue to underestimate the trends that could emerge if gold prices enter a secular bull market:
- A potential supercycle in commodities
- Emerging market assets likely to excel
- Resource sectors likely to lead
- Value stocks could outshine growth companies
- 60/40 portfolios may need to be redefined
- Structural increase in market volatility potentially ahead
- Cost of capital likely to remain elevated
- Emerging market currencies likely to outperform
These are all meaningful changes in a market structure that remains heavily reliant on suppressed volatility and continues to favor trends that run counter to the ones mentioned above.”
H/t
@RonStoeferle
Source.
ASB says Inflation Soon Back to Normal – We Say Hmmm…
ASB says:
“…the RBNZ will take considerable encouragement from the Q3 [RBNZ Business Survey] results that showed not only a continued fall in shorter-term inflation expectations measures, but also moves in the longer-term measures towards 2%. We are increasingly confident that annual CPI inflation will fall below 3% from Q3 of this year and that it will remain under 3%. Our core view (see a link to the August MPS here) is that the RBNZ cuts the OCR by 25bps next week.”
We say:
Yes the RBNZ is likely to follow the likes of Canada, the ECB and soon the US Federal Reserve in cutting rates. Whether that is in today’s RBNZ announcement or the next is likely the only debate.
However, we’d say don’t bet on the CPI falling below 3% and staying there. We expect this coordinated central bank easing to ignite another inflation wave. On top of this, here in NZ, we have a terrible electricity generation situation that is likely to lead to a surge in power prices too.
Gold Leading Commodity Prices Higher
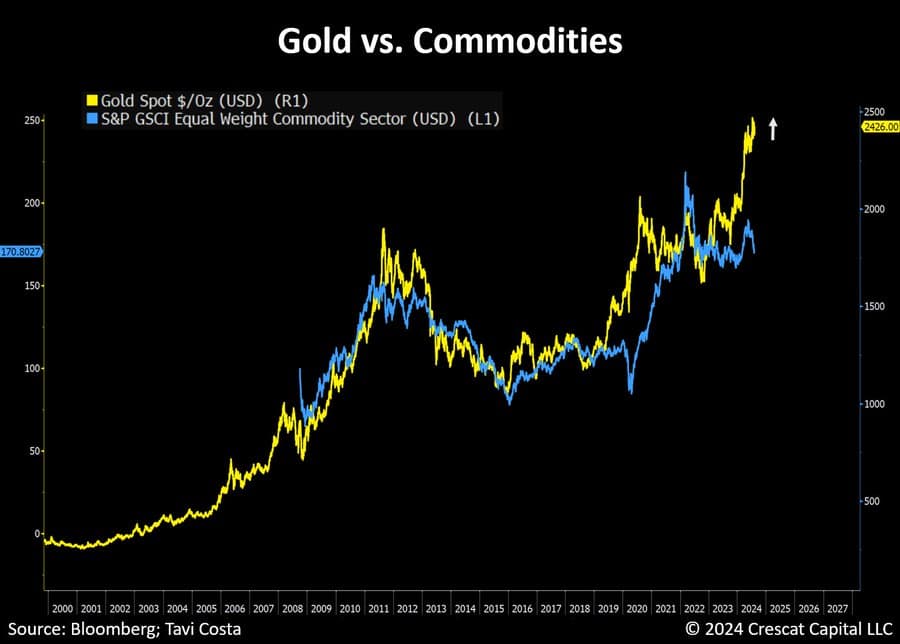
Tavi Costa also highlights how we might be in for rising commodity prices soon. And how that will have implications for inflation too:
Gold is likely leading commodity prices in a significant way.
It’s worth noting that this is happening while hedge funds are currently very bearish on commodities, which often indicates we might be nearing a major inflection point in these assets.
Not to jump too far ahead, but the inflationary implications of such a move could put the Fed in a tough spot in the coming months.
That’s the kind of pressure a stagflationary environment can create.
Source.
Some say deflation is the risk, we’d agree with Tavi that it is stagflation we should be watching out for. Just the kind of environment where our 2 favorite metals are likely to outperform.
Please get in contact for a gold or silver quote, or if you have any questions:
- Email: orders@goldsurvivalguide.co.nz
- Phone: 0800 888 GOLD ( 0800 888 465 ) (or +64 9 2813898)
- or Shop Online with indicative pricing
|