
Stewart Thomson was on the ball with his recent call that gold could likely find a bottom following the latest US jobs numbers announcement.
That is exactly what happened with gold bouncing higher from just above US$1300 last week.
So let’s check back in on what his latest thoughts are. He has some interesting thoughts on what is driving the gold market currently…
Gold And Silver: Good Times Are Here
Graceland Updates
By Stewart Thomson
- Gold has a rough general tendency to decline ahead of the monthly US jobs report, gyrate wildly when the report is released, and then rally modestly higher for another one to three weeks. The cycle tends to repeat itself with varying degrees of intensity.
- Please see below now. Double click to enlarge this daily bars gold chart.
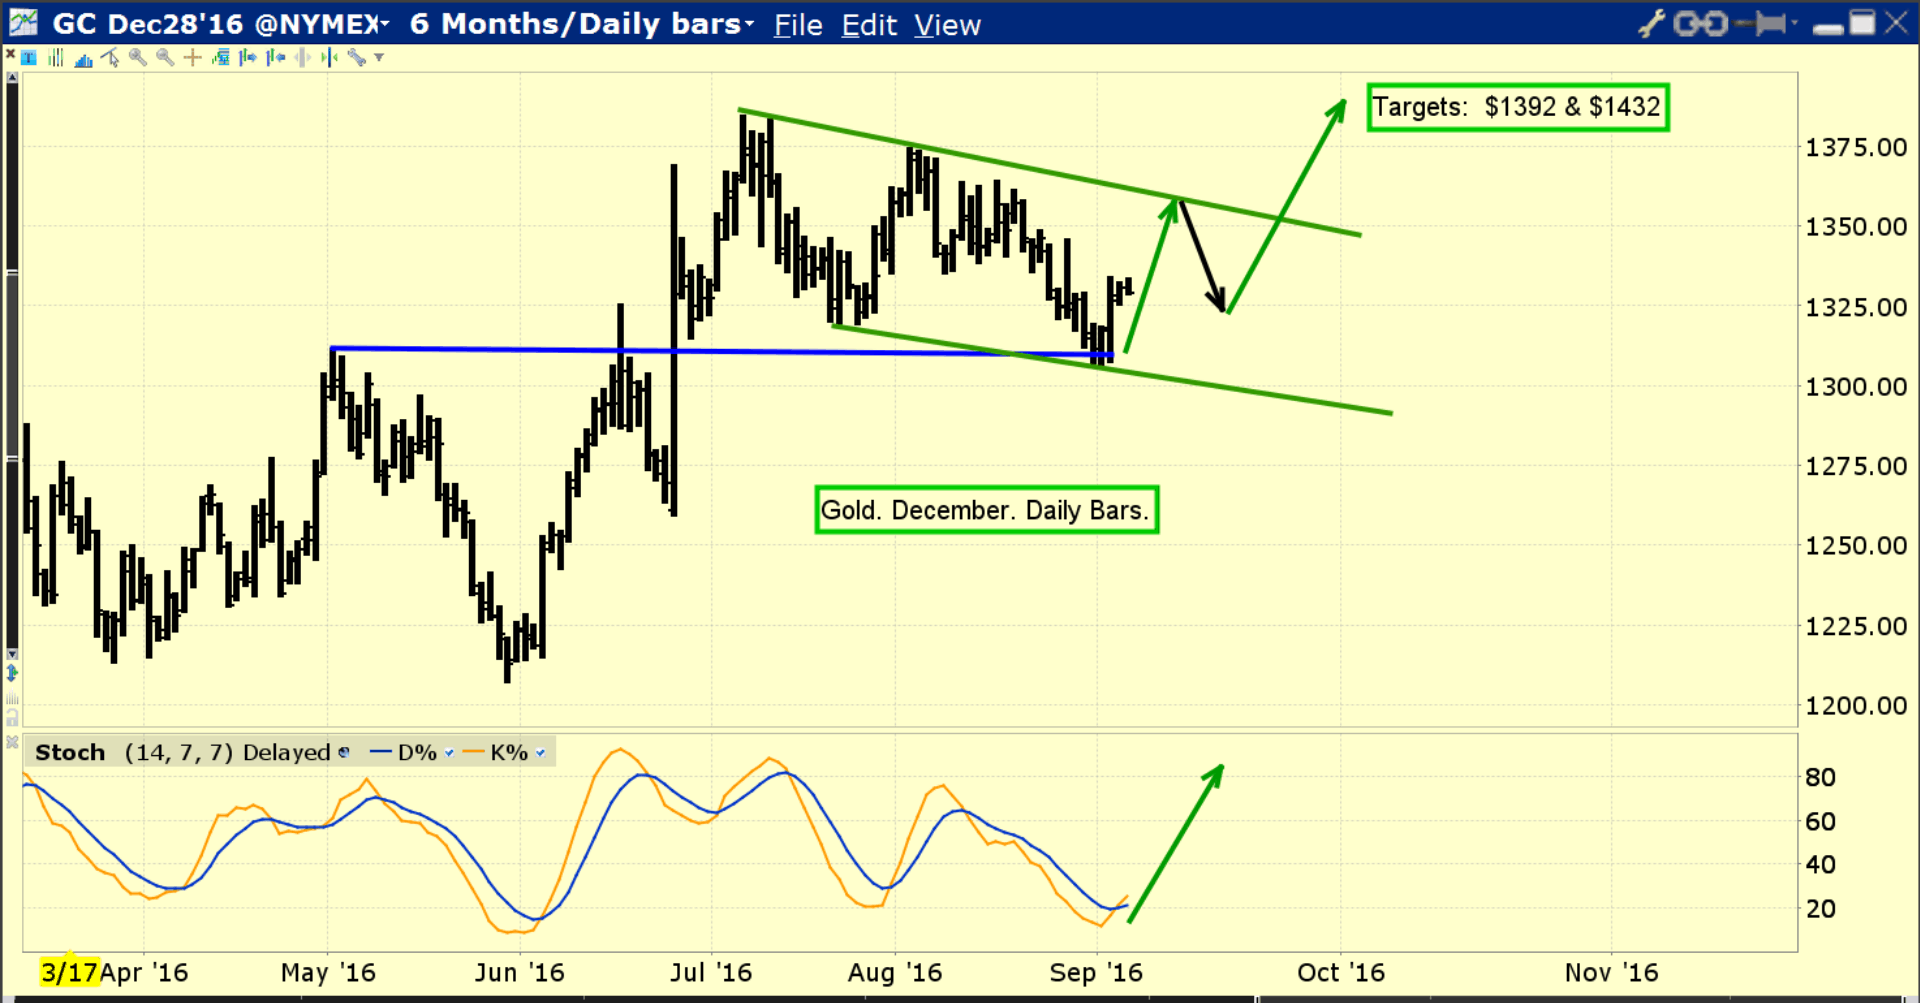
- It’s clear that gold responded to the latest jobs report in “textbook” fashion. I suggested gold would decline to about $1310 ahead of the jobs report. It went to about $1306.
- Since then, gold has rallied to about $1335 and the technical situation is now very good. Note the 14,7,7 series Stochastics oscillator at the bottom of the chart. There’s a crossover buy signal in play.
- Even though Indian demand is currently soft, gold is very well supported by institutional money managers. At this point in time, it could be persuasively argued that neither the love trade nor the fear trade are the prime movers of the gold price.
- Instead, gold is being supported by the “competitive cost of carry” trade. Low rates and negative rates on most fiat currencies make gold very attractive as a currency.
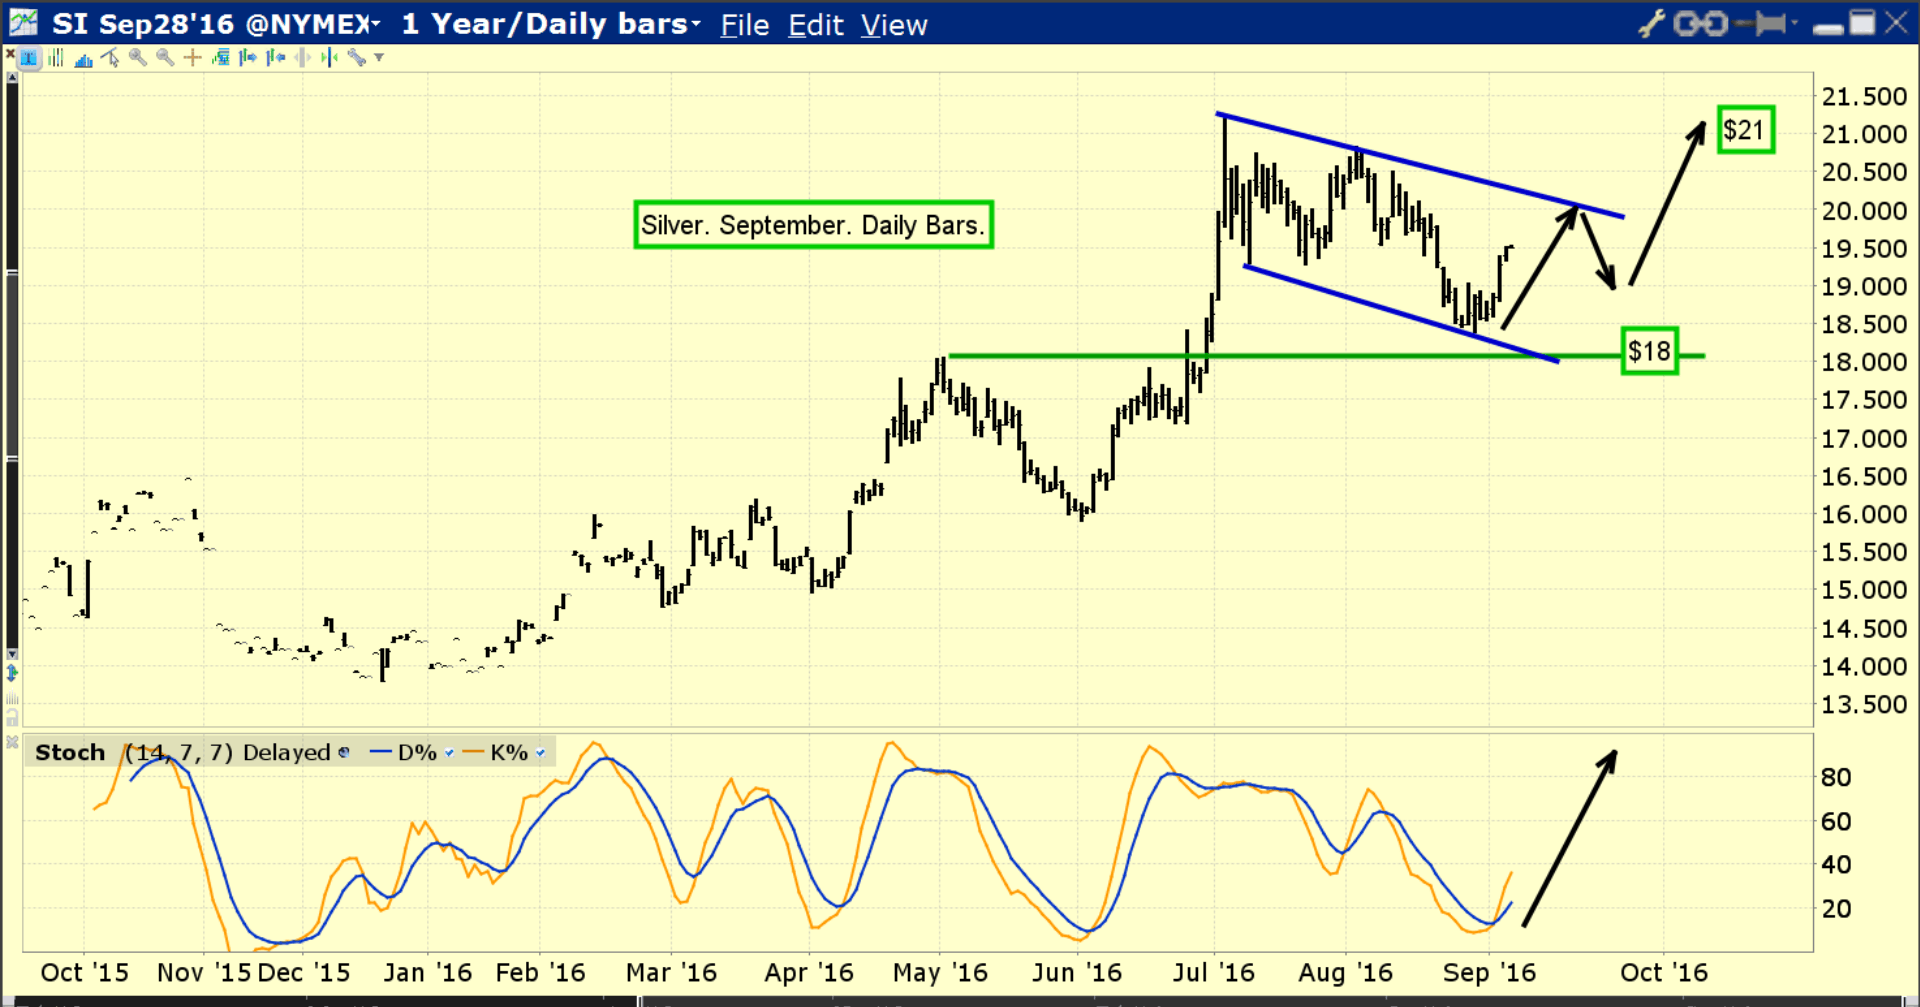
- Please see below now. Double click to enlarge. Silver also looks well supported, and the chart “feels” solid.
- The cost of carry theme means that in the short to medium term, a big price spike higher is unlikely, and a big tumble lower is equally unlikely. Obviously, at some point the fear trade will come back into play, and it’s very late in the game for the US business cycle.
- The US stock market tends to lead the economy by about six months. A rollover to the downside could happen any time between now and 2018, with September, October, and January being the most likely months for a meltdown to commence.
- Please see below now. Double click to enlarge this daily bars dollar versus yen chart.
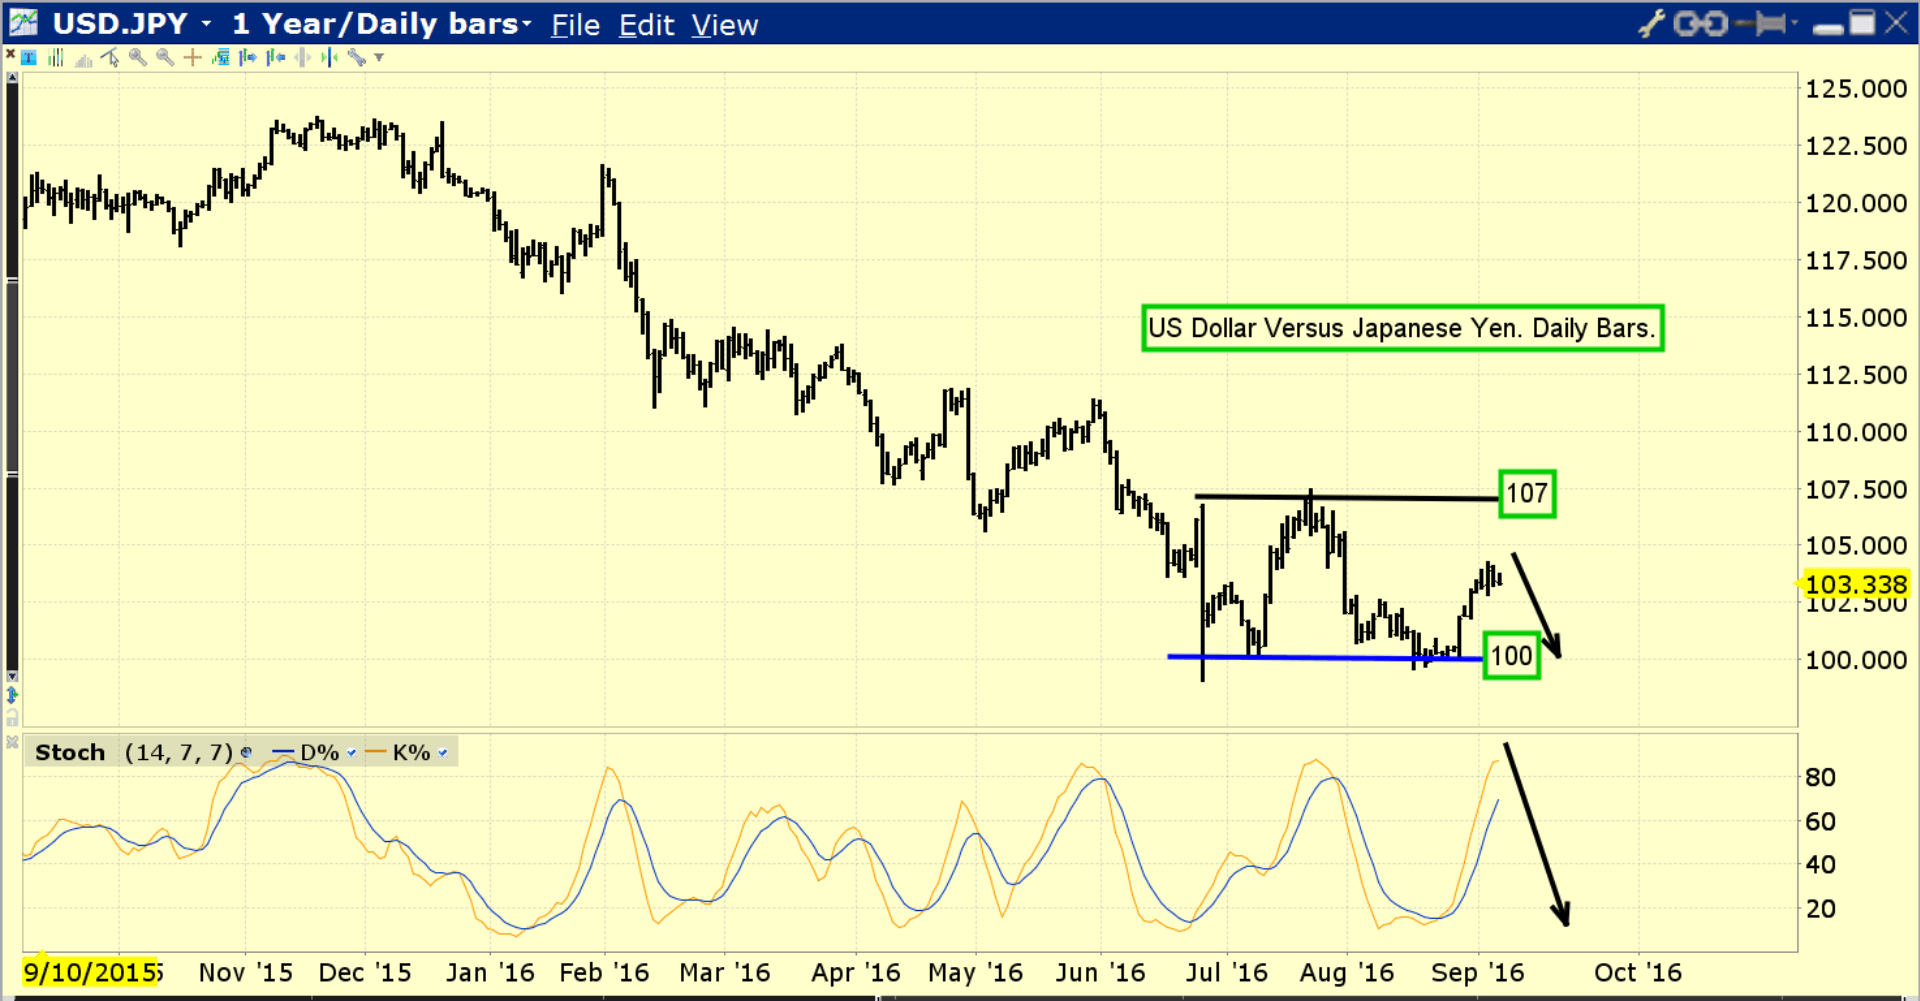
- Since tumbling to the 100 area on the Brexit event, the dollar has steadied and traded sideways between 100 and 107. The FOREX market is the largest market in the world, and price action of the dollar versus the yen has a huge effect on the gold price.
- Just as the dollar has rolled sideways against the yen since the Brexit, gold has drifted sideways in a rough $1370 to $1310 price range.
- In Japan, central bank chief Kuroda is likely to cut interest rates again at the upcoming September 21meeting. He’s also likely to increase his QE program.
- Kuroda may also try to stimulate bank lending by targeting his bond purchases at different types of bonds. If he’s successful, bank lending is inflationary, and good for gold.
- If he fails, gold will still benefit from the overall drop in interest rates. That’s because the drop in rates makes gold more competitive with fiat from a cost of carry perspective.
- The US central bank is also holding a key policy meeting on September 21. A rate hike should create a spike in fear trade demand for gold, because it would likely hit the stock market very hard.
- Amateur gold price enthusiasts should take note of the fact that gold is owned as a competitive currency by a myriad of unleveraged institutional money managers.
- In 2008, gold’s main owners were leveraged funds. Gold is in much stronger hands now than it was in 2008, and in the case of a stock market crash, gold may act quite a bit differently than it did in 2008.
- There’s a growing loss of confidence theme amongst institutional money managers, in regards to central banks around the world. Increasingly, gold is replacing T-bonds, and becoming the most favoured safe haven.
- Please see below now. Double click to enlarge this daily bars oil chart.
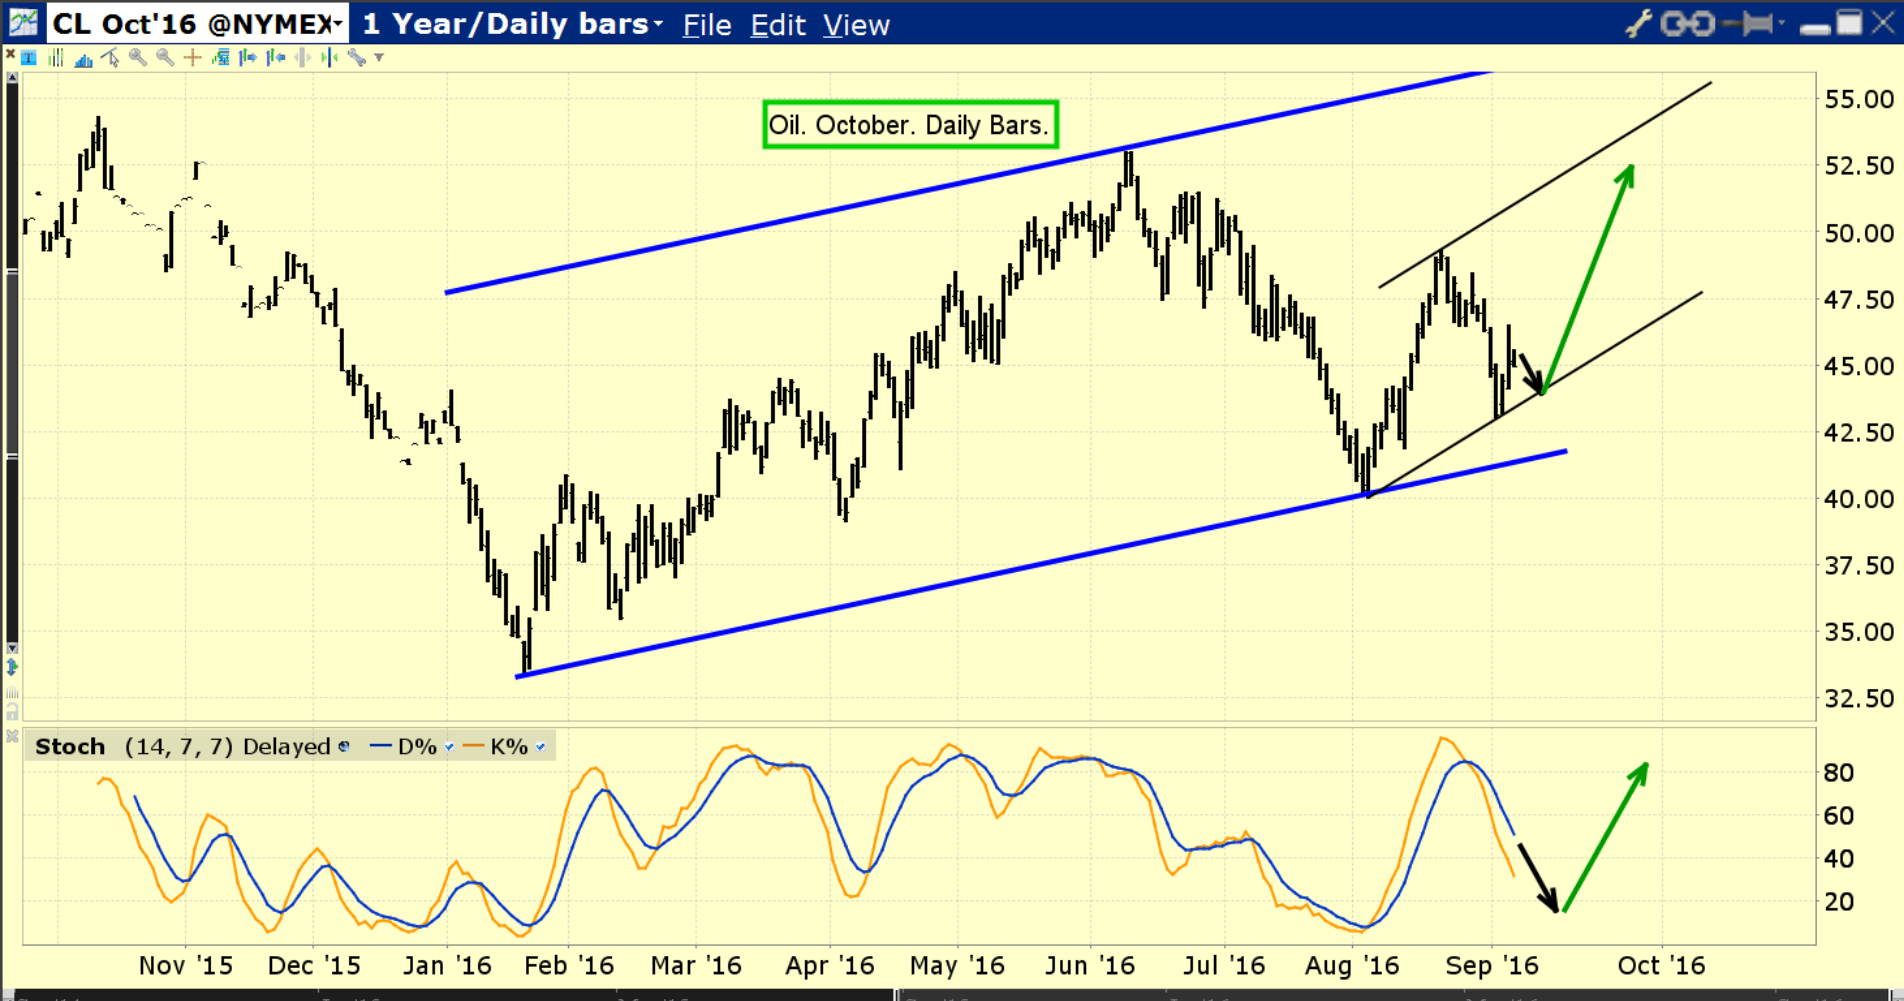
- Yesterday was a very important day for the global oil market; Russia and Saudi Arabia announced a“cooperation pact”. Oil spiked about two dollars higher on the news, and it may put a new floor under the oil price. The door to production cuts from OPEC is now open.
- US jobs reports show that jobs growth is probably peaking out. A price floor and even modestly higher oil prices will cause more money managers to begin to utter the stagflation catch phrase. That’s good news for gold.
- Please see below now. Double click to enlarge this key daily bars GDX chart. Both the $21 and $25 price zones are superb entry points for gold stock enthusiasts, and traders can be light sellers in the $27.50 and $32 area.
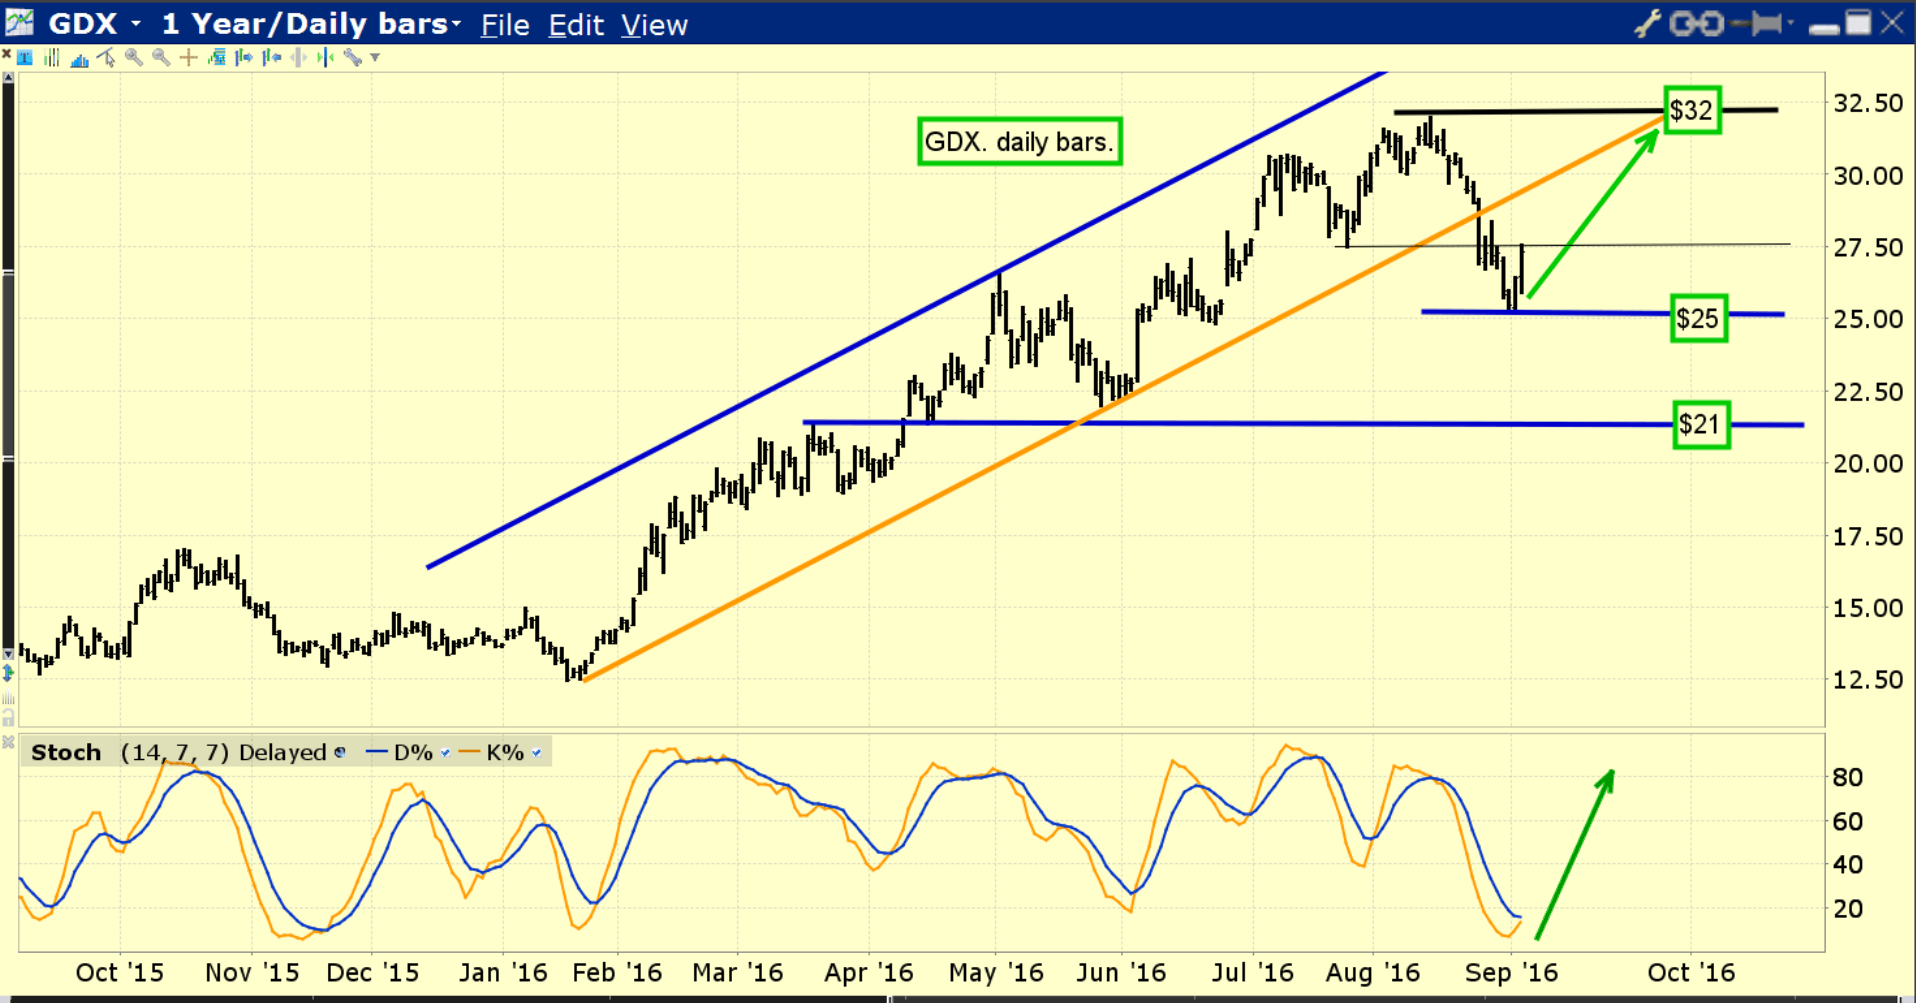
- Gold stocks are very well supported now, because gold is well supported by the competitive cost of carry trade. Against gold, gold stocks have been in a bear cycle since 1996. That cycle appears to be ending now, and its end will be confirmed by an upturn in bank loan profits and money velocity. A rising oil price floor could be the catalyst that creates the upturn. For the Western gold community, good times are here, and great times are near!
Thanks!
Cheers
St
Stewart Thomson
Graceland Updates
Note: We are privacy oriented. We accept cheques, credit card, and if needed, PayPal.
Written between 4am-7am. 5-6 issues per week. Emailed at aprox 9am daily.
Stewart Thomson is a retired Merrill Lynch broker. Stewart writes the Graceland Updates daily between 4am-7am. They are sent out around 8am-9am. The newsletter is attractively priced and the format is a unique numbered point form. Giving clarity of each point and saving valuable reading time.
Risks, Disclaimers, Legal
Stewart Thomson is no longer an investment advisor. The information provided by Stewart and Graceland Updates is for general information purposes only. Before taking any action on any investment, it is imperative that you consult with multiple properly licensed, experienced and qualified investment advisors and get numerous opinions before taking any action. Your minimum risk on any investment in the world is: 100% loss of all your money. You may be taking or preparing to take leveraged positions in investments and not know it, exposing yourself to unlimited risks. This is highly concerning if you are an investor in any derivatives products. There is an approx $700 trillion OTC Derivatives Iceberg with a tiny portion written off officially. The bottom line:
Are You Prepared?