|
Gold Survival Gold Article Updates: Oct. 23, 2014
This Week:
- Chinese and Indian Gold Buyers Are Back
- Indicator Shows Fed Could Act Again Soon
- Is Gold as Dead as Florida Hurricanes?
- How Can There Not Be a Currency Crisis?
We’ve got 2 videos and 3 articles on the website this week, so scroll down to check all them out. We’ve updated our email format so hopefully this might read a bit better for some of you too.
Charts and Prices
Not a lot of change for gold from a week ago.
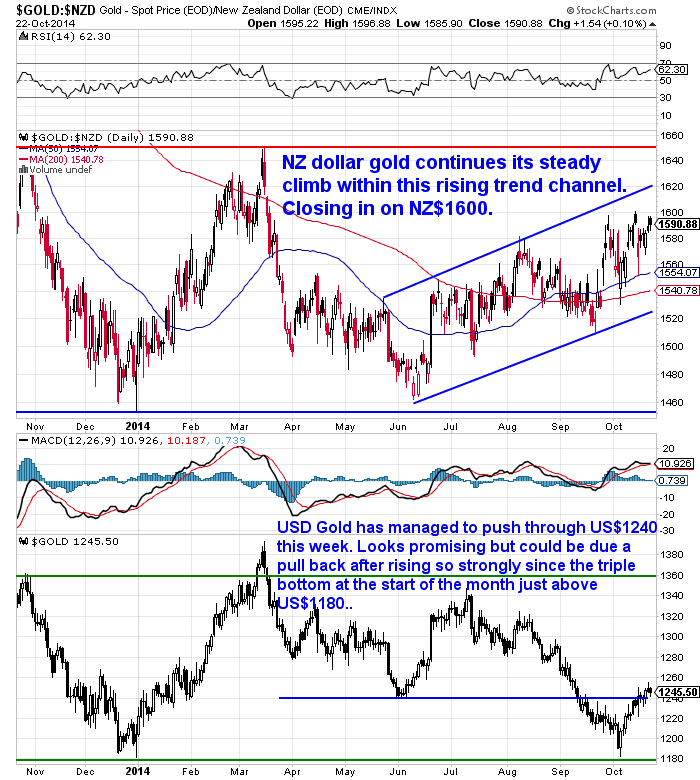
The price in USD last week was $1240.75 and we are up just $1.11 or only 0.08% to $1241.86 from then. You can see in the lower half of the chart below that USD gold has managed to get above the $1240 level but has struggled to get through $1250. Given the run higher from the triple bottom above $1180, it wouldn’t be a surprise to see a pull-back from here.
While in NZ dollars the gold price is up $12 or 0.77% to $1568. Care of the Kiwi dollar weakening around half a cent from 0.7974 down to 0.7920 today.

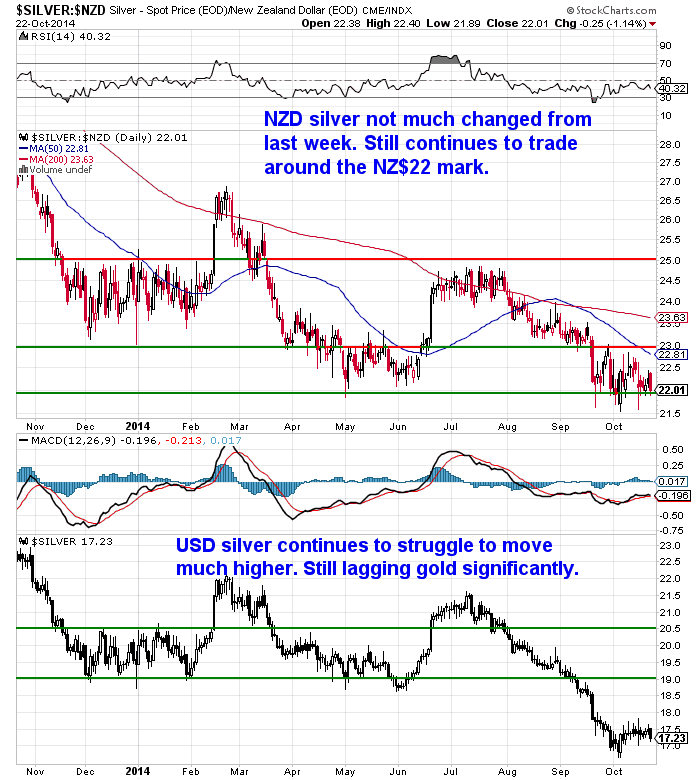
Silver in USD is down 29 cents or 1.66% to $17.17 after falling sharply overnight.
And the weaker Kiwi dollar did not prevent a loss for the week for silver priced in NZ Dollars either. It is down 22 cents or 1% to $21.68. So NZD silver remains right around the lows of the past 3 years. Good buying opportunity perhaps?

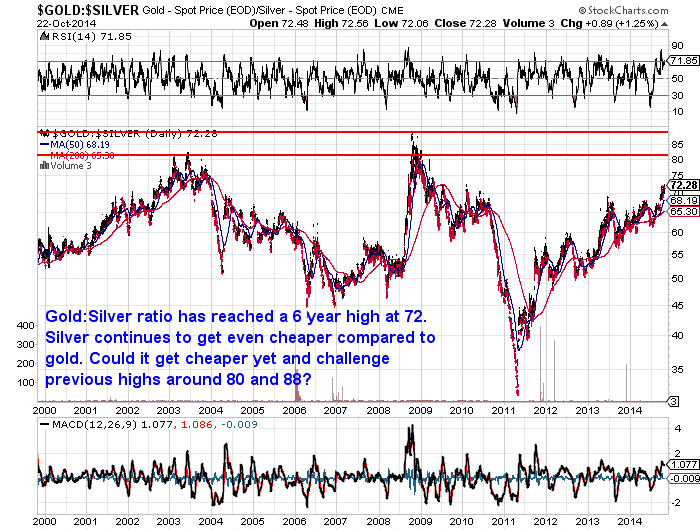
As the chart above shows silver has struggled to move up too much from it’s lows, while gold has jumped up a bit stronger. This has led the gold silver ratio (i.e. how many ounces of silver it takes to buy an ounce of gold) to reach 6 year highs.

Could we yet see it close in on previous highs around 80 and 88? Remember this doesn’t necessarily mean silver has to fall in price. It just could continue to lag gold.
Chinese and Indian Gold Buyers Are Back
It seems China and India thinks these prices are a good buying opportunity according to this report from mineweb.
—–
Chinese and Indian gold buyers back in market in a big way
“So gold hungry China and India continue to accumulate gold, between them at a rate which probably accounts for close to the full total of global mined supply. And there are another group of Asian nations with similar gold hoarding proclivities, not quite at the same scale, but cumulatively significant.
One may ask that, if indeed they are collectively accumulating more than global new mined supply, and with scrap supplies falling with the gold price, where all this gold is coming from. The gold bugs will tell you it is gold leased from the world’s central banks which now can never be returned because it now resides in strong hands – yet remains on their books because it is leased rather than sold. Last year it may have come from gold ETF liquidations which amounted to perhaps more than 700 tonnes, but although there have been some sales out of the gold ETFs this year they have been on nothing like the scale of 2013. So the conundrum remains. Demand has to be exceeding supply, yet the price keeps falling. Surely that has to end soon.
And, of course, there is the other big unknown in the gold market demand. Is China surreptitiously building its gold reserves, but not reporting the increase until it feels it is politically expedient so to do. There is a lot of evidence out there in speeches by top Chinese officials and academics (and in a tightly controlled country like China these would seldom be made without some kind of government approval) that China is looking to build its gold reserves to around 8,500 tonnes, thus topping the US’s 8,133.5 tonne official reserve figure. But no-one knows for sure.”
—–
These demand numbers seem to be backed up by Swiss customs data out this week, which showed huge September exports from Switzerland to China and India.
Luckily UBS has just come out with a report on it so saved us digging too heavily through the Spreadsheet. Here’s the main highlights:
—–
“UBS: Swiss Gold Exports At 7-Month High; Physical Demand Absorbing Investor Liquidations
Swiss trade data show gold exports hit a seven-month high in September and that the flow to Eastern from Western nations continues, says UBS. Swiss exports were 172.6 metric tonnes last month, the most since February. Gold shipments to China jumped to 12 tonnes after averaging around three tonnes during the previous four months.
Shipments to Hong Kong increased to 24.7 tonnes, the most since April. Switzerland exported 58.5 tonnes to India last month, the largest shipment year to date and nearly twice the average monthly volume, UBS says.
Meanwhile, September gold imports into Switzerland were also high at 194.6 tonnes. Inflows from the U.K. jumped to 63.3 tonnes from 8.6 in August. “This suggests that a good portion of investor liquidations in September, that pushed the prices through the $1,200 psychological level, were absorbed by physical demand, with metal making its way from London vaults into Swiss refineries for refining/recasting and ultimately shipped to physical buyers in Asia,” UBS says.
Source
—–
Indicator Shows Fed Could Act Again Soon
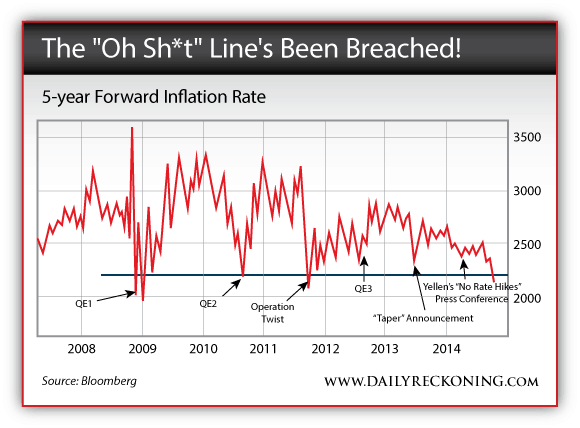
You may recall the stock market plunge was seemingly halted last week by comments from Fed member James Bullard commenting that the Fed could resume money printing soon. We saw an interesting post in the Daily Reckoning this week where an inflation indicator may well back this up. The humourously titled “Oh Sh*t” line! AKA – the “Fed’s five-year forward inflation rate.
—–
‘In fact, the Fed recently crossed the “oh sh*t” line. The very line that Jonas Elmerraji at our trading desk says predicated QE1, QE2, the so-called Operation Twist and QE3.

“The Fed’s five-year forward inflation rate,” Jonas told me this morning, “has fallen below that 2.2% line for the first time since Operation Twist in 2011. Not only is this the lowest it’s been since Janet Yellen’s tenure as Fed chief started, and not only is it the lowest we’ve seen forward inflation drop since Operation Twist — so far, it’s actually the only time post-2008 that the Federal Reserve has allowed that inflation gauge to drop below 2.2% without announcing a massive quantitative easing program.”
“Either there’s a major change here, the economy is healthy and deflation doesn’t matter anymore,” concludes Jonas, “or we’re in store for a major Fed action soon.” Hmmn.’
—–
As noted in our silver chart last week, the weaker silver price compared to gold could be an indicator of worries over deflation. Silver’s industrial properties could mean less demand for it if indeed the global economy takes another downturn.
At home here in NZ inflation (at least according to government numbers) is expected to be fairly mute over the past quarter. ASB analysts “CPI data released here on Thursday will show a 0.5% increase over the quarter.”
So we continue to think that for all the talk both here and in the US of higher interest rates it simply isn’t going to happen anytime soon.
Ronald-Peter Stoferle’s latest piece for King World News also backs this view up. He analyses GDP versus Debt numbers and shows how Public Debt versus Government Revenue is a more accurate measure. This measure shows how rates simply can’t rise. Definitely worth a read this one. It’s pretty short too.
Still Concerned About The Gold & Silver Smash – Just Read This
So as Lawrie Williams of Mineweb noted above, “[Gold] Demand has to be exceeding supply, yet the price keeps falling. Surely that has to end soon.”
Indeed, it would seem like it should but who knows when is the trouble. But when it does we could likely see some large movements in price higher so it might be difficult to get aboard the train then.
These near record low silver prices in particular mean the chance to get a monster box of Canadian Silver Maples for just $13,160 delivered and fully insured. Check out the details below for other options or get in contact if you have any queries.
|