Gold has been popping up a good deal more in the mainstream of late and there have been plenty of mentions of a bubble-like state. Wells Fargo Bank recently released a report where they stated that gold was in a speculative bubble. This was perhaps a not altogether surprising statement from a bank whose majority owner is Warren Buffet – at best someone who misunderstands gold, at worst a renowned gold hater.
But rather than paying attention to the mainstream posturing we prefer to keep track on actual measures. As we discussed in this previous article “When will you know it’s time to sell your gold?”, there are a number of indicators we like to track to see how gold is performing and that may help to determine when it might be getting near to a top in the precious metals bull market.
Some of these indicators include:
- The Dow/Gold Ratio
- The Housing/Gold Ratio
- The Gold/Silver Ratio
- Real Interest Rates
- Gold as a Percentage of Global Financial Assets
The Dow/Gold Ratio
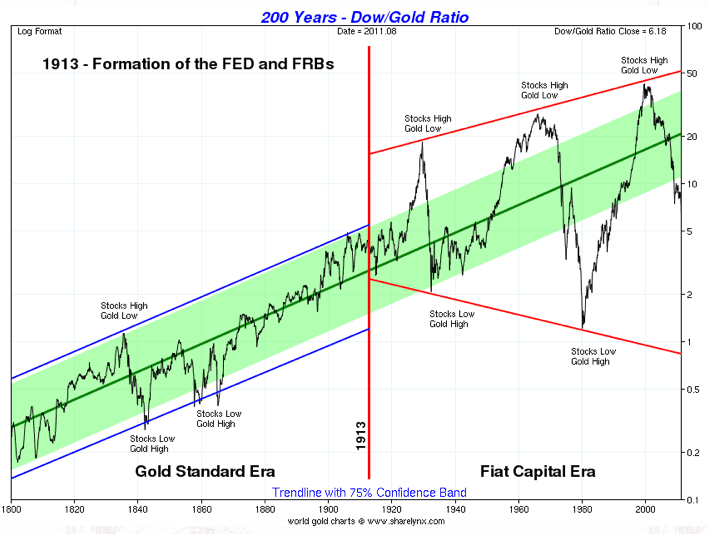
The dow/gold ratio is simply the US Dow Jones industrial average index divided by the gold price plotted over time. It can give an indication of overvaluation and undervaluation of the 2 components. When we last looked at this the Dow/gold ratio was at just under 10 – now it stands at 6.8.
So while it has fallen significantly further it is still some way off the ratio of just above 1 that it reached in 1980. The below chart courtesy of Sharelynx.com actually predicts the ratio may fall to slightly below 1 in the future based upon the higher highs and lower lows in the cycle over the past 100 years. Not coincidently these extremes have occurred over the same period that the Federal Reserve has been in existence. The Feds main aim is one of price stability which it seem pretty obvious from this chart that they’re lousy at!
The NZ Housing/Gold ratio
We’ve written on this topic a number of times already so you can review these articles for a full low down on this ratio:
But basically it is just the median New Zealand house price divided by the NZ dollar gold price to give us the number of ounces of gold it takes to purchase the median house. We haven’t updated our NZ Housing to Gold chart since March but that only included data until the end of 2010 as the long term housing index data we used is published quarterly.
However just checking quickly at the Real Estate Institute of New Zealand to get the most recent median NZ house price gives us a ratio of 192, which is down slightly from the end of last year when the NZ housing to gold ratio stood at 200. But since the end of July, gold in NZ dollars has risen over $200. So assuming the average house price hasn’t changed much since July the ratio may be closer to 170 now.
So this seems to be going to plan with the ratio continuing to fall. However it is still a long way off the target of 50-100 ounces of gold to buy the median house. So on this basis gold still appears significantly undervalued compared to housing in New Zealand.
The Gold/Silver Ratio
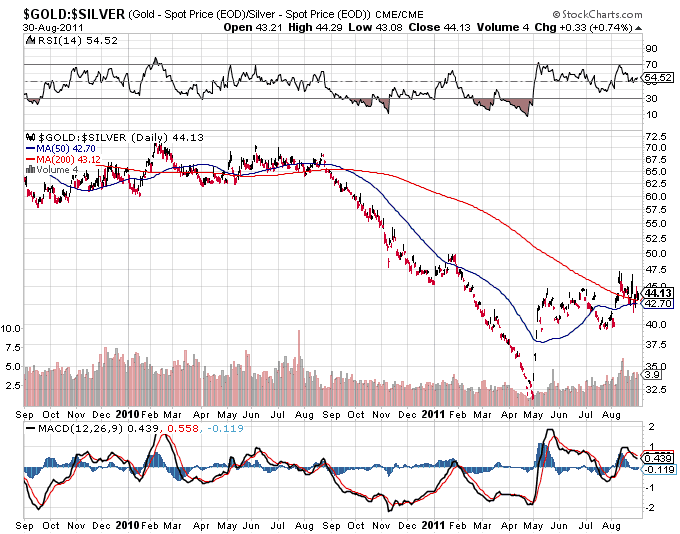
The long-term historical average for the gold silver ratio is about 16:1. i.e. gold is 16 times more expensive than silver. Depending on what numbers you go by this is somewhat close to the suggested ratio of the metals in the ground. But of particular interest is the fact that a ratio of 14 was reached at the end of the 1970’s precious metals bull market.
So the premise is that we may be heading back to around 16 as silver regains greater monetary recognition. Gold could continue to rise but silver could just rise faster.
The ratio currently stands at 44 but got down to as low as 32 at the end of April this year. So we are still some way off 16, which could arrive somewhere near the peak of the current precious metals bull market. It could also indicate that silver is a better buy than gold right now with it still being someway off it’s highs of earlier this year.
Real Interest Rates
Real interest rates are simply interest rates less the current rate of inflation. This is a major factor in driving people into holding gold. Intuitively this makes sense – why leave your money sitting idle in a bank losing money to inflation? If rates were significantly positive then this would encourage people to deposit money with banks to earn a return on their capital. We are obviously not in such an environment right now.
Here in NZ the 90 day bank bill rate is a hair under 3% currently while inflation measured via the official CPI is running at 4.5%. So that looks pretty negative to us. Even if we listen to the government tell us that this is merely a temporary high because of the GST increase and CPI should be only 3.3%, that reduced rate still leaves interest rates negative.
And with the US Federal reserve promising to keep interest rates at close to zero until 2013, but the price of everyday goods continuing to rise, it seems likely that interest rates could remain negative for some time yet. US interest rates are certainly negative too.
Gold as a percentage of financial assets
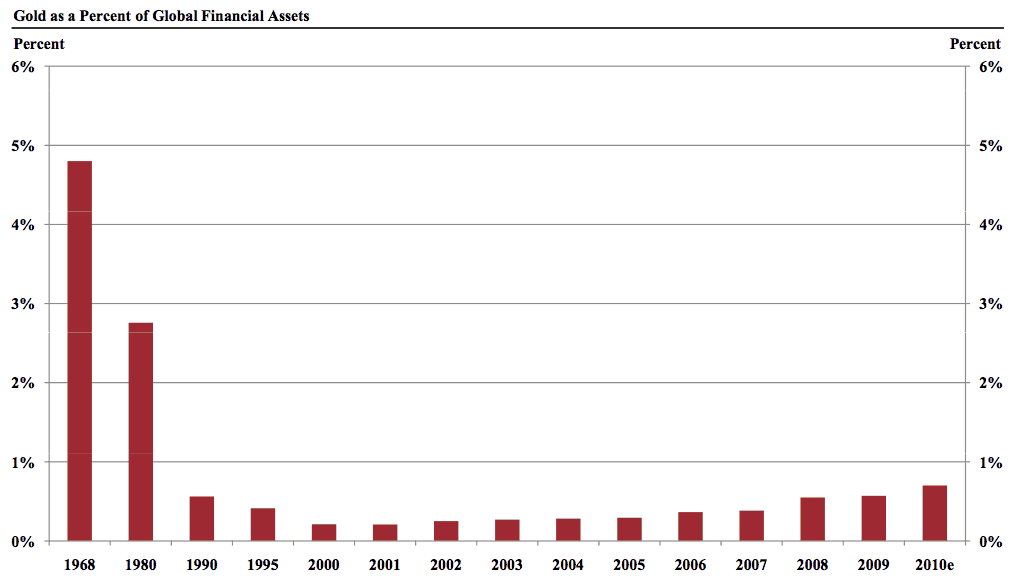
In 1968 gold was just under 5% of global financial assets. It declined for the next 30 years down to about 0.2% in 2000. Since then it has slowly risen but currently still stands at only about 0.7% of global financial assets, so it seems it has a way to rise yet to even get back to what it was at in 1980 at the end of the last gold bull market (just under 3%).(Source: CPM Group Gold Yearbook 2011)
So is gold in a bubble?
So looking at the above measures gold is not in a bubble in our opinion. We have some way to go in all of them to get to historical lows. Of course that is assuming we are heading to them. However the political response to the ongoing crisis is pretty much going to plan. With most governments not prepared to make any meaningful changes. The current system requires more and more debt in order to kept it going and that seems to be the modus operandi of the powers that be. Until that changes our guess is that these measures will keep trending in the direction they have been going for the past few years.


Great article! Thanks
Pingback: Just how low could gold fall? | Gold Prices | Gold Investing Guide
Pingback: Chicago Fed head Evans Fed still needs to do more | Gold Prices | Gold Investing Guide
Pingback: How Much Further Might Gold Fall - What About in NZ Dollars? - Gold Prices | Gold Investing Guide