Prices and Charts
NZD Gold Closing in on $3050
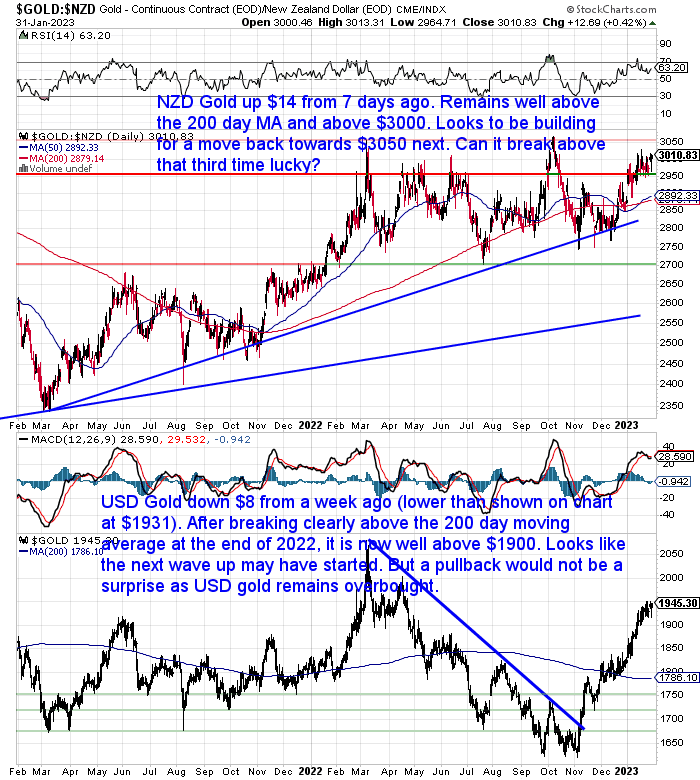
Gold in NZ dollars was up about half a percent from 7 days ago, aided by a weaker Kiwi dollar.
It sits above $3000 today and remains well above the 200 day moving average. It won’t be a surprise to see it head towards $3050 now. Then the question is, can it break above the $3050 level after being turned back twice before in 2022?
We get the impression that NZD gold is building for a higher move. Possibly we see it turned back on the first attempt and then it regroups and busts through after that?
While gold in USD just keeps heading higher. It’s not shown on the lower chart, but USD gold remains overbought on the RSI indicator. So it remains overdue for a pullback. But maybe we’ll just see a small correction back to around $1900? As gold looks to be very strong at the moment. Aided by the fact that it has risen so solidly without any fanfare. So we could yet see it head up towards the high above $2050 before any major pullback.
NZD Silver Up Over 1%
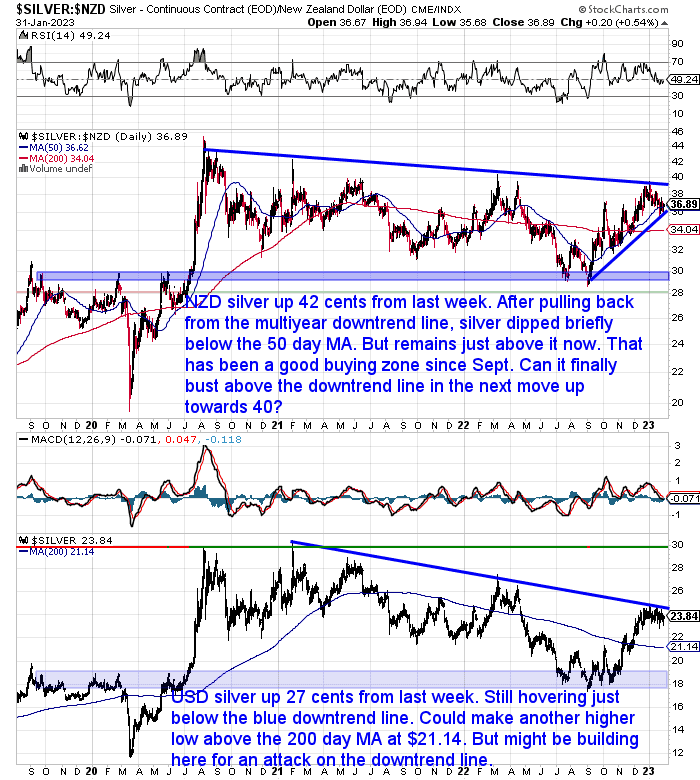
Silver in New Zealand dollars is up 42 cents from last week. In the first month of 2023 NZD silver has pulled back after touching the multi year downtrend line. It dipped briefly below the 50 day moving average (MA), but today remains just above that line. The 50 day MA has proven to be a very good buying zone since silver bottomed out back in September. With the RSI also neutral (near 50), this could again be an excellent long term entry point for silver. Can we now see it move up towards the blue downtrend line and then the round number of $40?
Meanwhile USD silver remained pretty flat for the week. Up just 6 cents. It continues to hover just below the multiyear downtrend line. It could yet make another higher low somewhere between here and the 200 day MA at $21.14. But it might well be building here for an attack on the downtrend line.
Higher than Expected Unemployment Rate Nudges NZ Dollar Lower
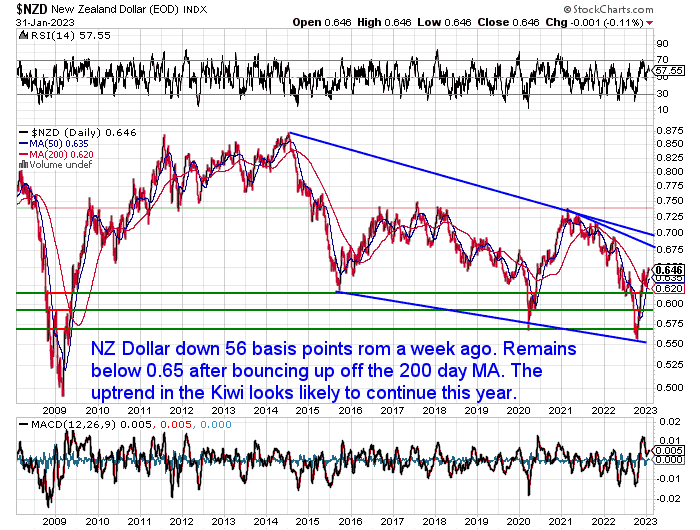
The New Zealand dollar was down 56 basis from a week ago. Most of that fall came this morning after the latest unemployment numbers came in a shade higher than predicted:
“The seasonally adjusted unemployment rate was 3.4 per cent in the December 2022 quarter, compared with 3.3 per cent last quarter, Stats NZ said today.
That was slightly higher than market expectations and most economists’ forecasts and may mean the Reserve Bank can moderate its interest rate hikes.
The BNZ today lowered its forecast for this month’s OCR hike to 50 basis points – from 75 basis points.
It also lowered its forecast peak track to 5 per cent, from 5.5 per cent.”
Source.
But we’d guess that despite this week’s fall, the uptrend for the NZ Dollar looks likely to continue this year.
Need Help Understanding the Charts?
Check out this post if any of the terms we use when discussing the gold, silver and NZ Dollar charts are unknown to you:
Continues below
—– OFFER FROM OUR SISTER COMPANY: Emergency Food NZ —–
Long Life Emergency Food – Back in Stock
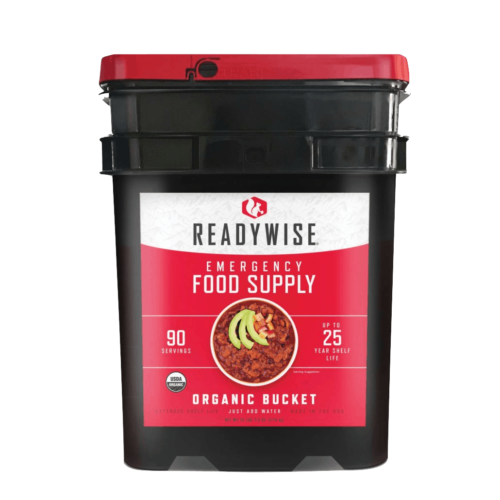
These easy to carry and store buckets mean you won’t have to worry about the shelves being bare…
Free Shipping NZ Wide*
Get Peace of Mind For Your Family NOW….
—–
How Much is All the Gold in the World Worth in 2023?
Gold (especially in US dollars) has been on a steady march higher since November. In USD terms it is up over $300 per ounce. It is also only about $130 below the all time USD high. So how has this rise affected the value of all the gold in the world?
Thai week’s feature article looks at how this has changed over the past 2 years. You’ll also discover:
- How Do You Calculate the Total Value of All the Gold in the World?
- How Much Gold is There in the World?
- Here’s the Value of All the Gold in the World in US Dollars
- How Does This Value Compare to all the Debt in the World?

Your Questions Wanted
Remember, if you’ve got a specific question, be sure to send it in to be in the running for a 1oz silver coin.
US Stock Market to Return Zero for Next 12 Years?
John Hussman of Hussman funds recently tweeted:
“Interest rates are no longer at zero.
Prospective 10-12 year S&P 500 total returns still are.
That’s likely to become a problem.”
Source.
The chart that accompanied this tweet isn’t the easiest to understand. But a later chart is.
To his tweet someone replied:
“Wait. You think expected nominal SPX total returns over 10-12 years is zero?
Like, that’s the mean outcome?”
Hussman came back with an interesting chart:
“Yes – made the same projection at the 2000 peak. Estimate about 1% for a passive mix of 60% SPX, 30% bonds, and 10% T-bills. That’s what a decade of yield-seeking speculation driven by zero interest rate policy has set up for investors.”
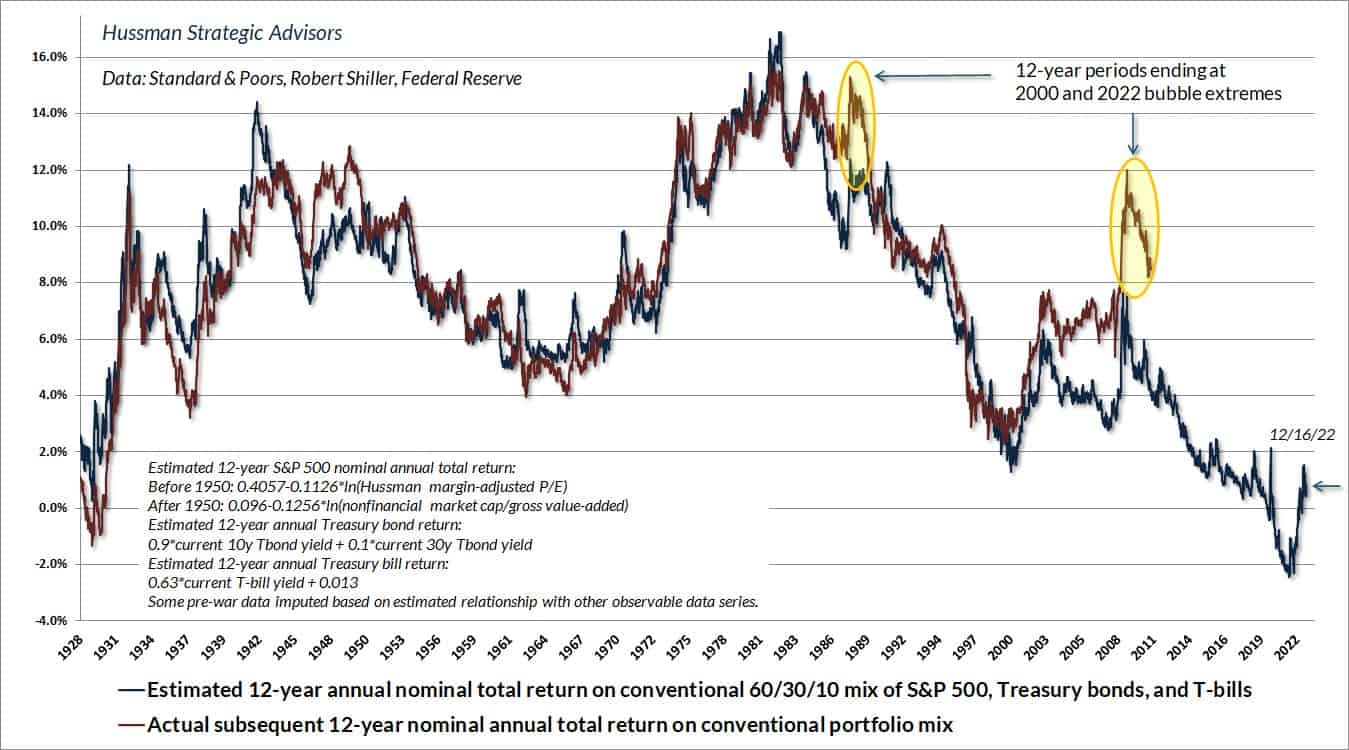
Hussman has a system where they predict what the estimated 12 year return for a 60/30/10 split of the S&P500, US treasury Bonds and T-Bills will be. The blue line in the chart shows that right now this system predicts the return to be not much above zero for the next 12 years.
The red line shows the actual which is why it only goes up until 2011. As you need 12 years of future data to know what the actual returns were.
This next chart also gels nicely with what Hussman predicts.
Tech stocks (NASDAQ index) were the best performers in recent years. So it stands to reason that in downtimes they will be the worst performers.
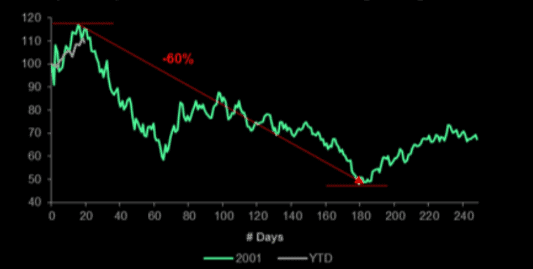
But they have bounced back in 2023, up more than 10% in January, leading some to think the worst is behind us. But here is an interesting comparison to the last time the NASDAQ was up more than 10% in January…
The last time NASDAQ was >10% in January…
Tech upside has been the main pain trade (outlined here on Jan 8). The last time NASDAQ was up more than 10% in January was in 2001. This was after having seen significant multiple contraction the year before. NASDAQ continued to go down by more than 50% for the rest of 2001.
BNP Paribas
Source.
We continue to think NZ and the world face years of higher inflation to come, but also years of poor performance in the areas that have performed well in recent years. Namely stock markets, Housing and bonds.
Yield Curve: Recession is Coming – Bad for Investment Returns
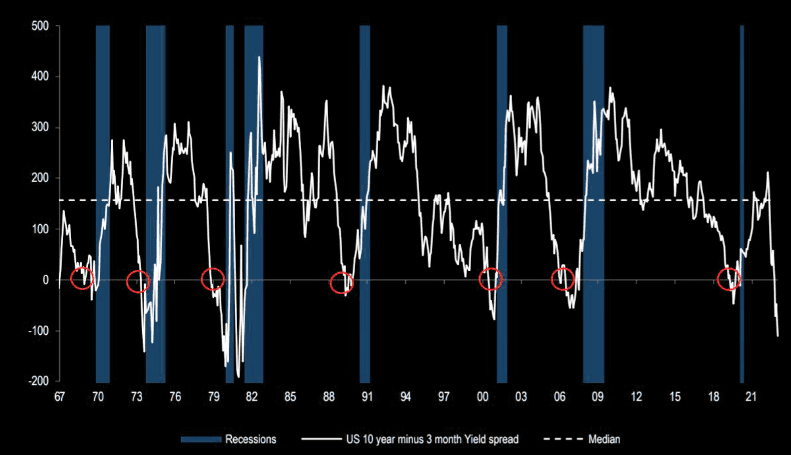
High interest rates and a recession are not good for most investment returns. We already have high interest rates. While a recession in the USA is exactly what the yield curve is predicting.
The grey bars in the chart below indicate a recession took place every time this has happened in the past:
The yield curve is never wrong
A super-soft kitten style landing is what everyone expects now, at the same time as the yield curve, which was never wrong, continues to paint a very different picture. (US10YR – 3M)
JPM
Source.
For a more detailed explanation of the yield curve see: The Yield Curve Recession Predictor 2022: Impact on Gold?
But in a nutshell, when the yield curve inverts it means the spread between interest rates for long term bonds and short term bonds drops below zero.
Because if bond investors believe a recession is coming, they expect the value of the short-term bonds to plummet sometime in the next year. That’s because the Federal Reserve usually lowers the fed funds rate when economic growth slows.
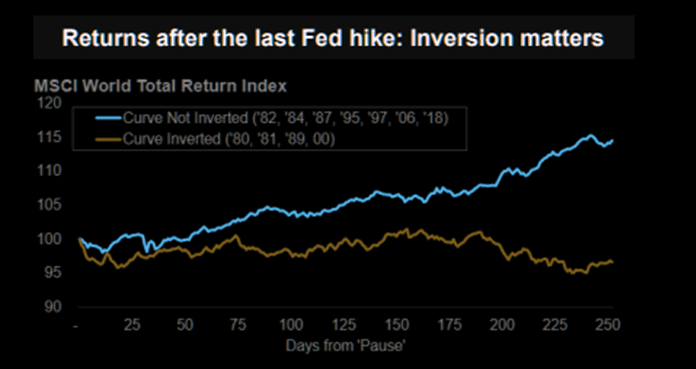
This next chart adds weight to Hussman’s theory that returns will be close to zero. It shows that when the yield curve is inverted, returns following the last Fed rate hike are also negative. So even when the Fed pauses its hikes, history shows that 250 days later the world total return index is still lower.
Inversion matters
Returns after the last Fed hike.
Morgan Stanley
Source.
The above data certainly leads us to think we should expect sub par investment returns in most assets for the coming years.
As John Hussmand nicely puts it:
“By relentlessly depriving investors of risk-free return, the Fed has spawned an all-asset financial bubble that now offers return-free risk. Whatever y’all think you’re doing here, it’s not “investment.””
Source.
In this environment we should expect above par performance for gold and silver. So make sure you have enough of them to balance out what you may not get from other assets.
Get a quote on gold or silver products:
- Email: orders@goldsurvivalguide.co.nz
- Phone: 0800 888 GOLD ( 0800 888 465 ) (or +64 9 2813898)
- or Shop Online with indicative pricing
— Prepared for the unexpected? —
Never worry about safe drinking water for you or your family again…
The Berkey Gravity Water Filter has been tried and tested in the harshest conditions. Time and again proven to be effective in providing safe drinking water all over the globe.
This filter will provide you and your family with over 22,700 litres of safe drinking water. It’s simple, lightweight, easy to use, and very cost effective.
—–
|