We’ve got another helping of Stewart Thomson this week. Apart from his usual comments on the gold, silver and mining index charts, he also has a look at the action in the US Treasury Bond market.
He’s not the only one to notice some action there. Is it significant though?
See what he reckons…
Janet And Gold: Does History Rhyme?
Graceland Updates
By Stewart Thomson
- Good things come to those who wait, because patience is a virtue.
- Over the past few days, various Fed presidents and governors have made both hawkish and dovish statements.The US stock market and gold stocks have reacted violently to these statements.
- It’s important for all gold stock investors to understand that anything can happen at next week’s critically important FOMC and BOJ meetings.
- Ahead of those meetings, it’s clearly a time for patience. Once the meetings have been completed, institutional investors will begin to apply large amounts of liquidity to the markets, and a new intermediate trend will be underway.
- On that note, please see below now. Double-click to enlarge this daily bars gold chart. I annotated this chart a week ago, predicting a rally to the trend line in the $1355 area, and then a pullback from there to $1325.
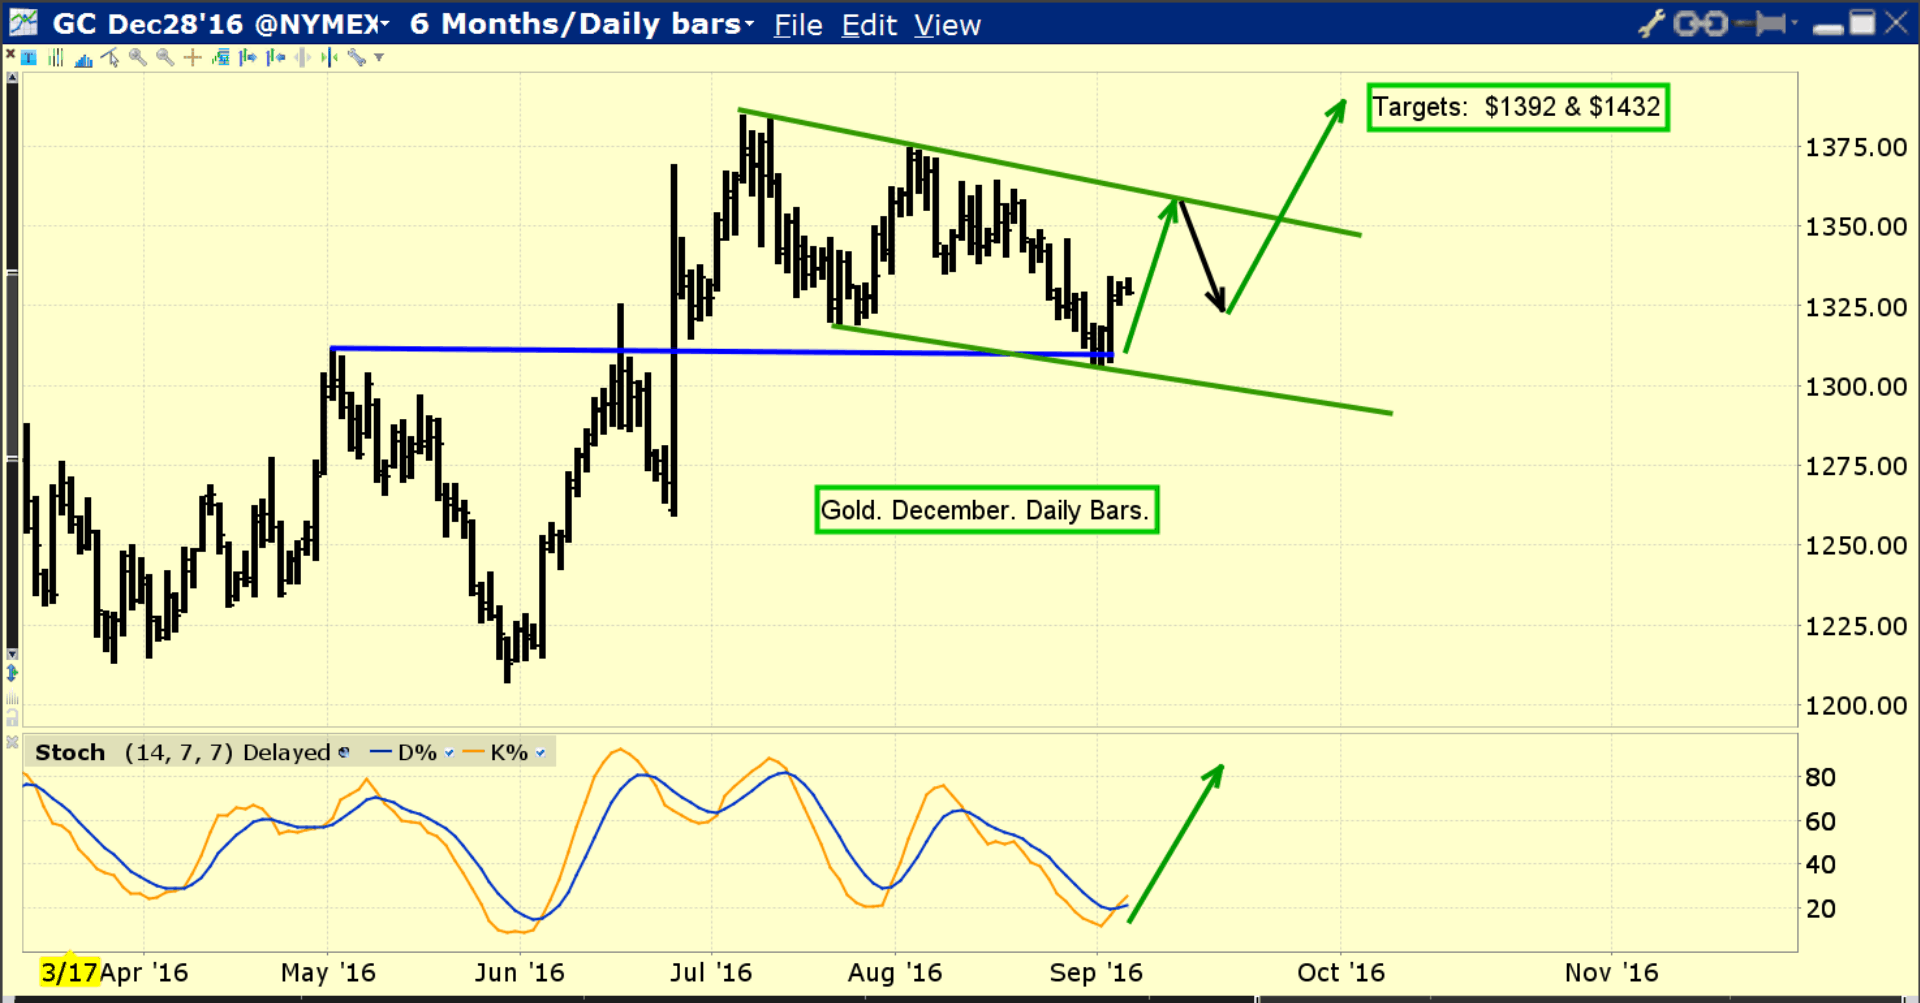
- To view what actually occurred, please see below now. Double-click to enlarge. Gold followed the exact trajectory I predicted.
- All that’s left now is for gold to stage an upside breakout from the drifting rectangle pattern, and begin the rally to my $1392 and $1432 target zones.
- That is unlikely to occur until next week’s FOMC/BOJ meetings are completed.
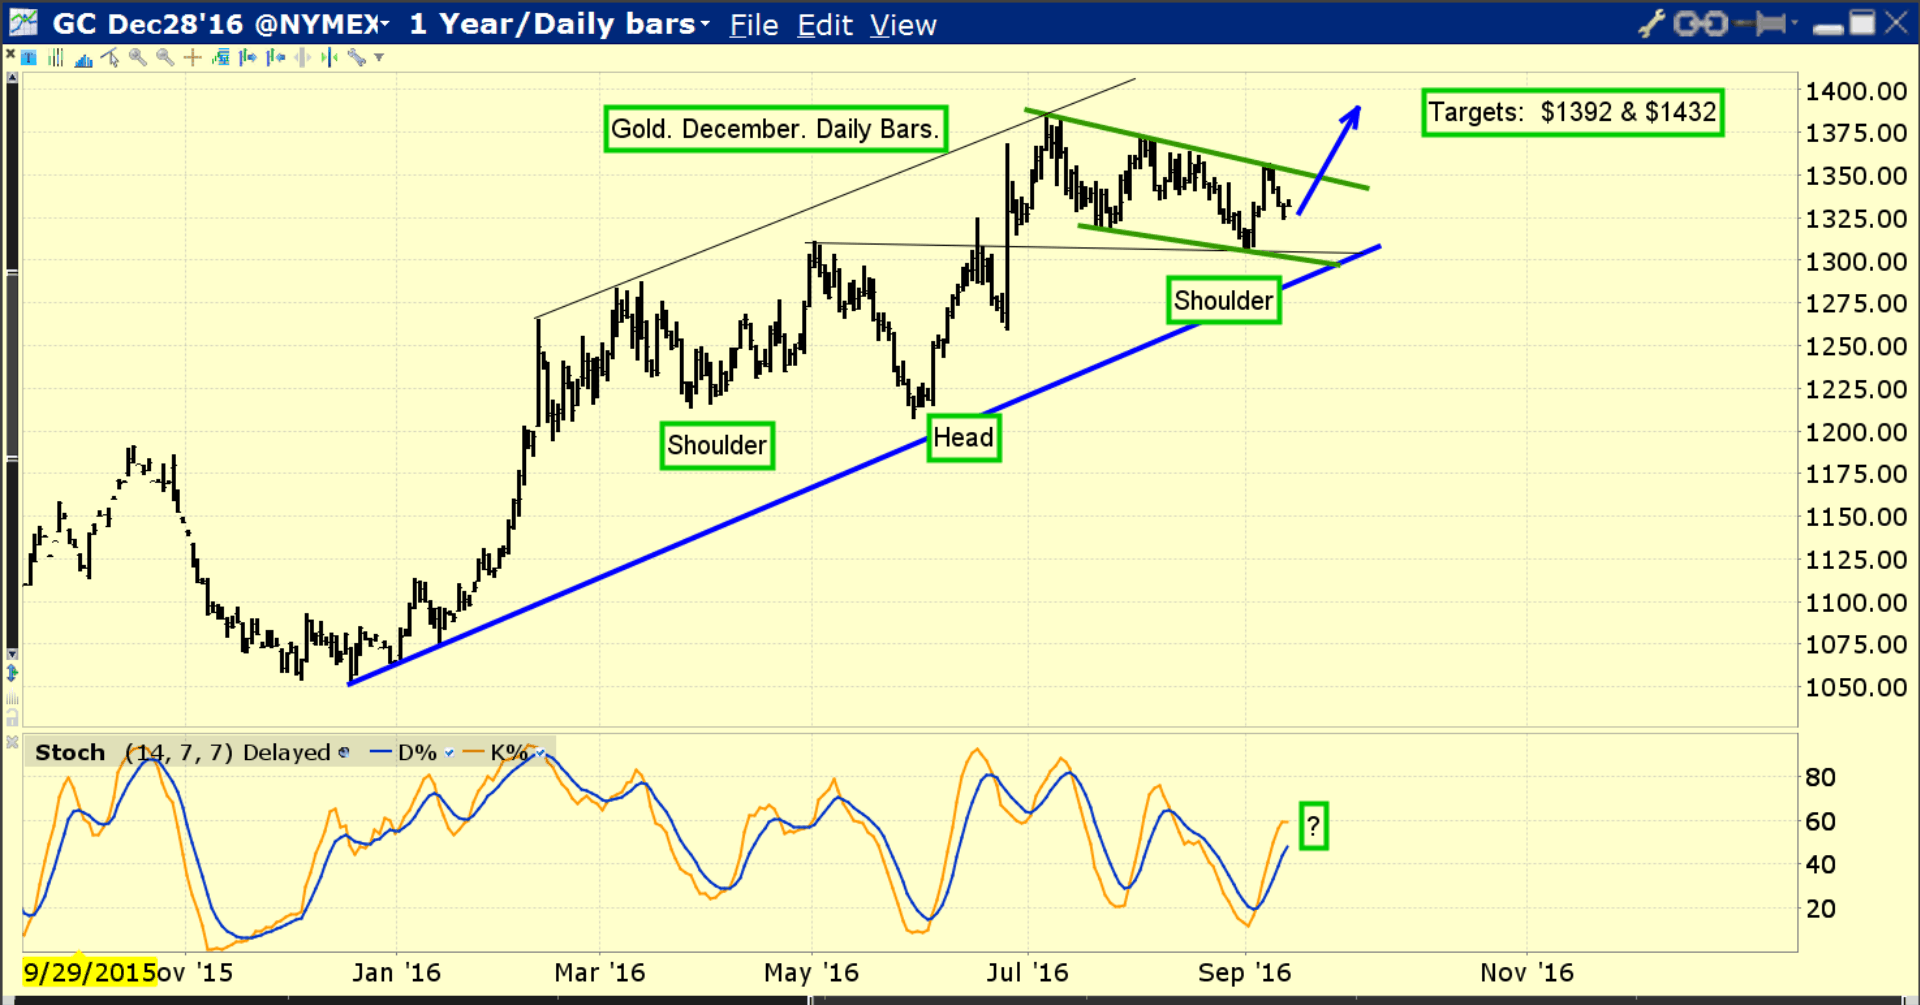
- Please see below now. Double-click to enlarge this monthly bars gold chart.Many technicians have noticed this bull wedge pattern, and they are predicting a kind of parabolic move to begin after an upside breakout.
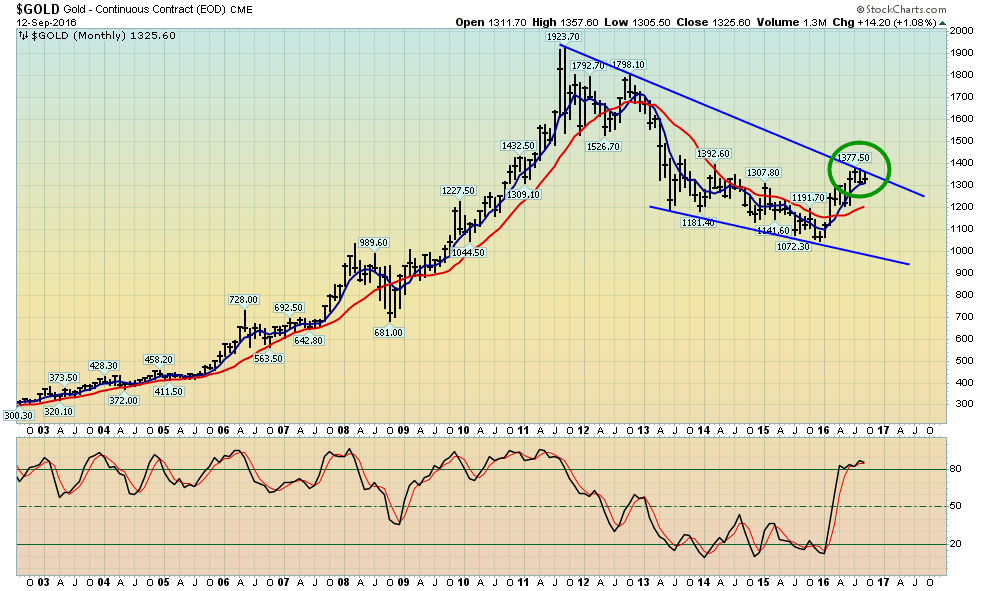
- While that sounds wonderful, these technicians may be quite disappointed by what actually transpires if there is a “breakout”. Please see below now. Double-click to enlarge this quarterly bars chart.
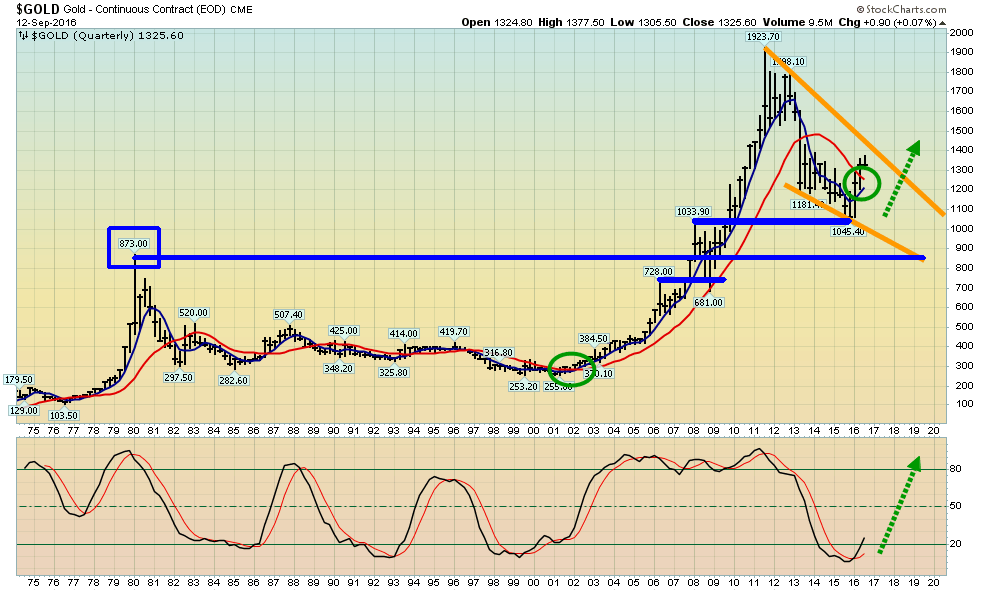
- Upon close inspection, it’s clear that gold could rise to $1432 over the next quarter, and still be contained within the bull wedge pattern on the quarterly bars chart.
- Also, there is massive overhead resistance in the $1492 – $1523 price zone. Gold is extremely well supported by value-oriented institutional money managers, but most of the price appreciation is coming from the low relative cost of carry that gold is showcasing against major fiat currencies.
- It would take a huge fundamental catalyst like a US stock market crash, bond market crash, or a geopolitical black swan event to create a dramatic acceleration in gold’s current rate of price appreciation.
- On that note, please see below now. Double-click to enlarge this daily bars T-bond chart. Despite the cheerleading speeches given by some Fed speakers, there is some clear technical damage occurring in the bond market.
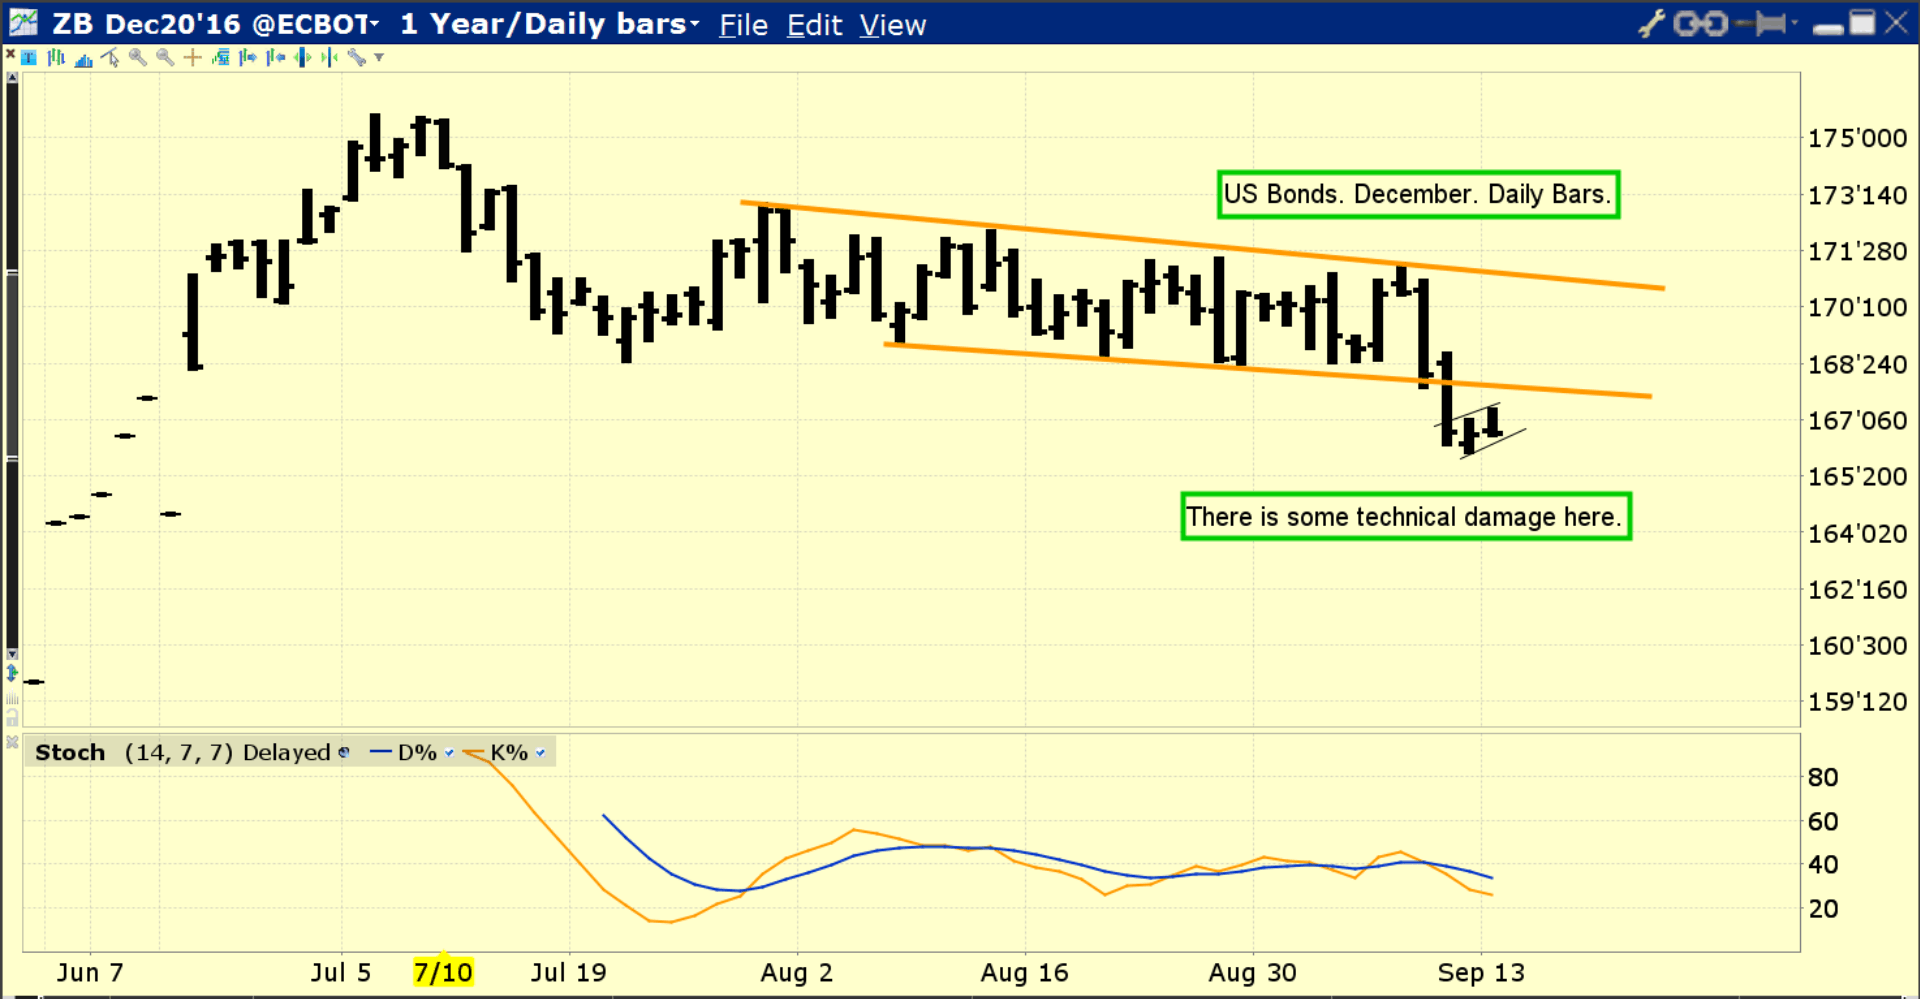
- Whether that damage is foreshadowing something bigger or not will only be made clear by what happens at the FOMC/BOJ events.
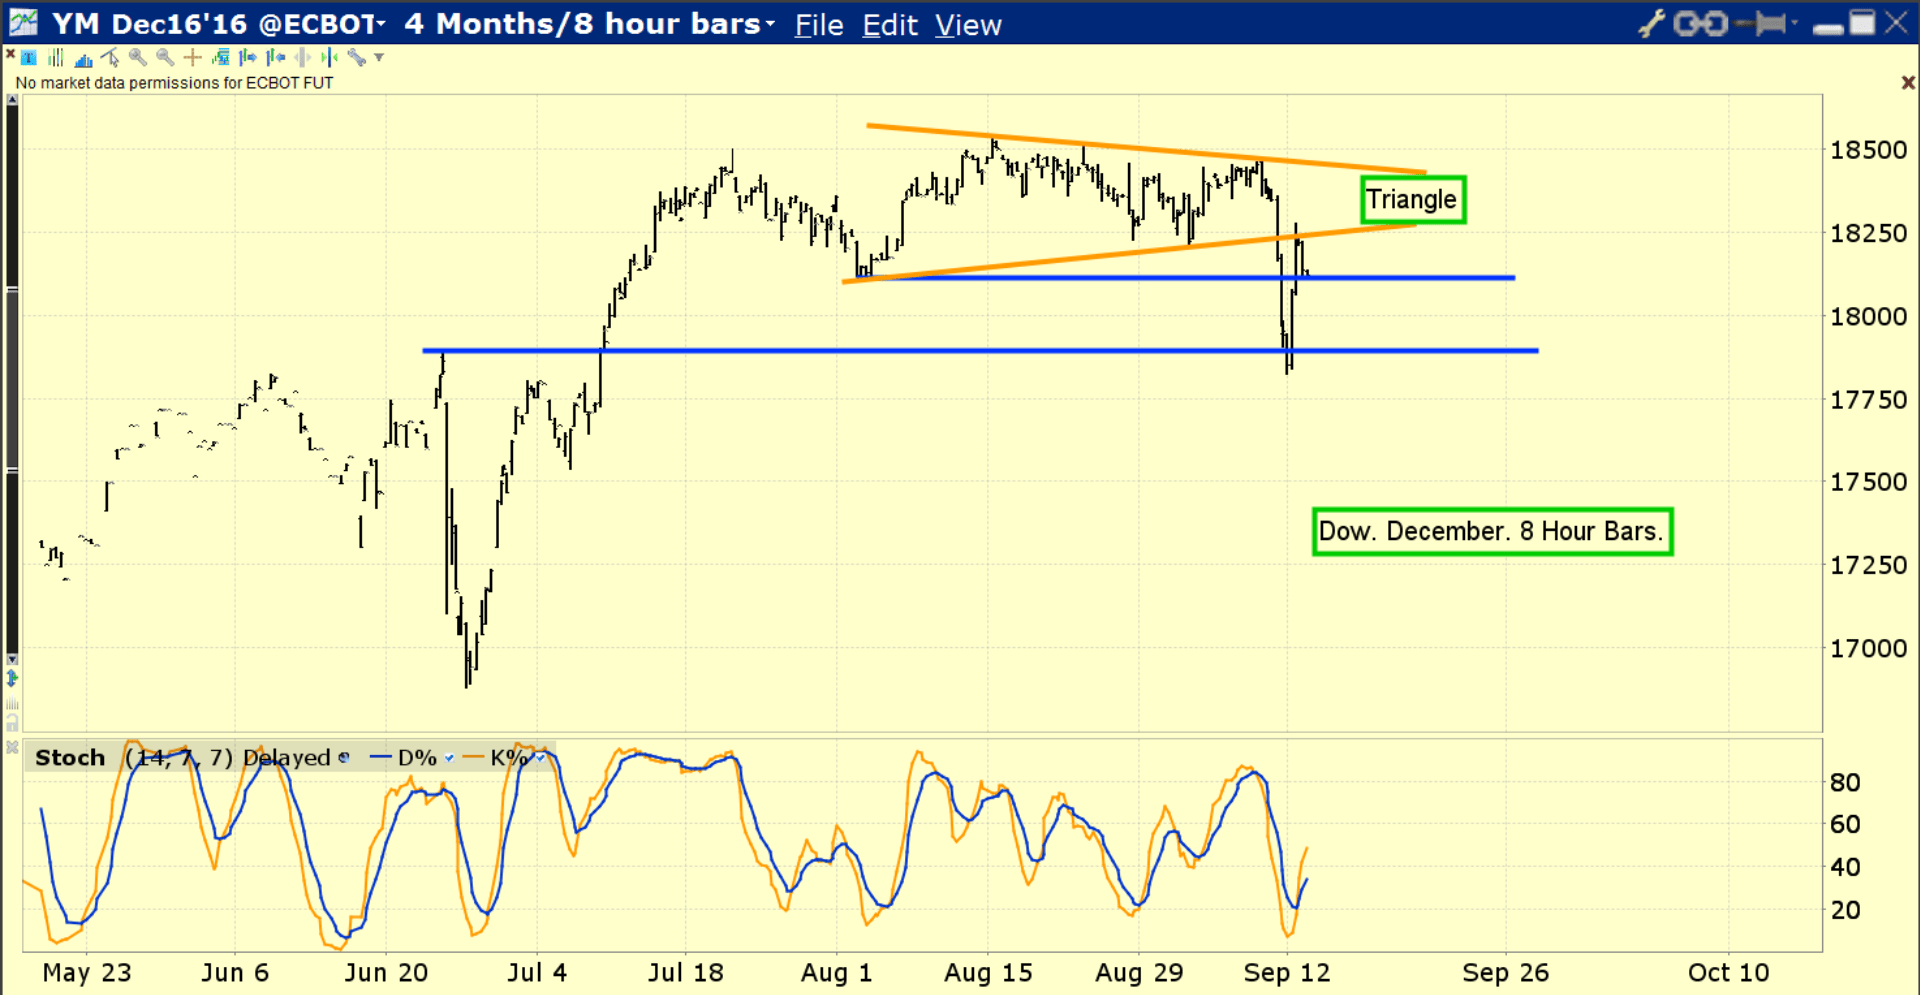
- Please see below now. Double-click to enlarge. This eight hour bars chart of the Dow presents a similar picture; the US stock market staged a partial recovery from Friday’s hammering, but if Janet Yellen actually does raise rates next week, the stock market may begin a horrific decline.
- A rate hike would only increase the relative cost of holding gold compared to fiat slightly, but it could create massive gold and yen safe haven buying if the US stock and bond markets crashed. Going into next week’s critically important central bank meetings, it’s win-win for gold.
- Most mainstream economists believe the odds of a September rate hike are about 30% or lower. Clearly, a shock announcement from Janet has the potential to create massive stock and bond market carnage.
- Many investors are perplexed because September is historically a very good month for gold price appreciation. That’s true, but the February to June period is seasonally week, and gold did well this year.
- Also, the September strength is caused by Indian festival buying, and after two years of drought the farmers there have substantial debts. So, Indian gold demand is muted.
- Please see below now. Double-click to enlarge this GDX daily bars chart. The $27.50 – $29 area can be lightly sold, and the $25 – $26 area can be lightly bought until the central bank meetings are finished.
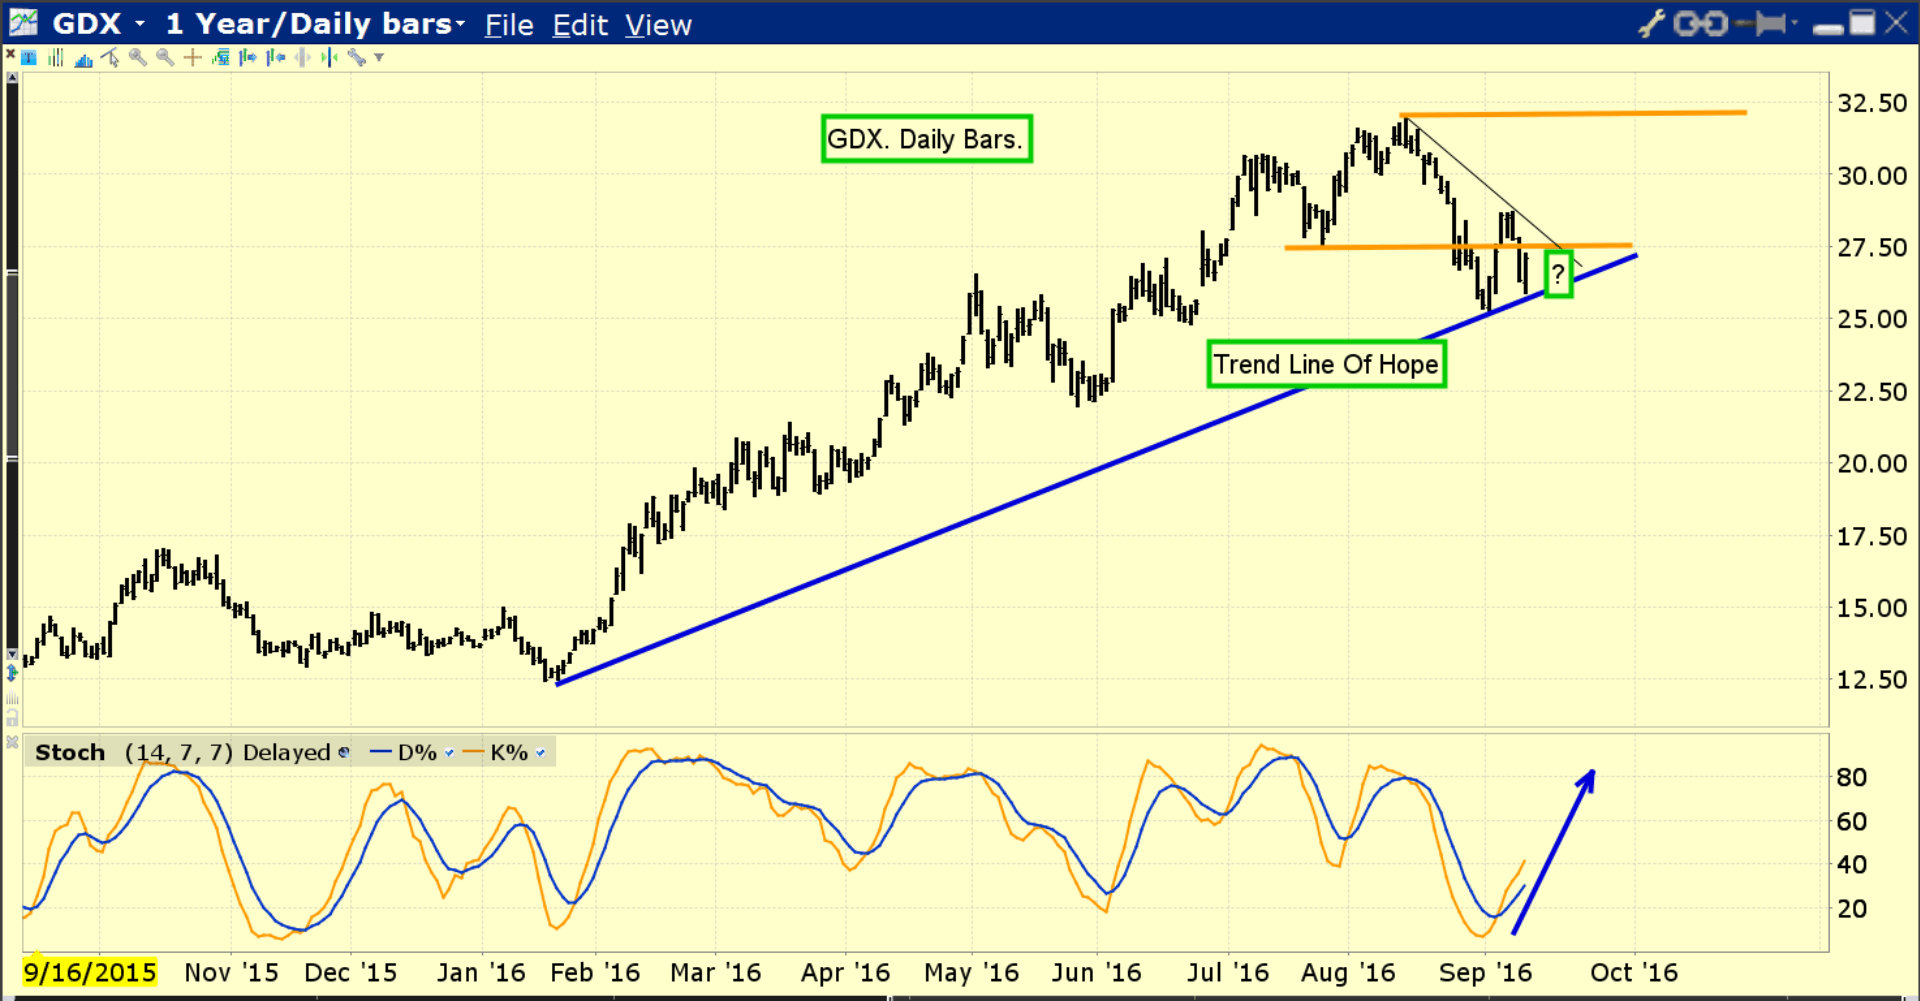
- If there is no rate hike next week, GDX should challenge the $32 area highs, and lead bullion higher.
- If there is a rate hike, GDX and most gold stocks will likely spike lower while bullion soars higher, in a scenario similar to what happened when Janet hiked in December of 2015.
- The good news is that after a very brief decline when Janet hiked last year, gold stocks staged one of the biggest rallies in many years. If she hikes next week, I expect history to rhyme!
Thanks!
Cheers
St
Stewart Thomson
Graceland Updates
https://www.gracelandupdates.com
Email:
Stewart Thomson is a retired Merrill Lynch broker. Stewart writes the Graceland Updates daily between 4am-7am. They are sent out around 8am-9am. The newsletter is attractively priced and the format is a unique numbered point form. Giving clarity of each point and saving valuable reading time.
Risks, Disclaimers, Legal
Stewart Thomson is no longer an investment advisor. The information provided by Stewart and Graceland Updates is for general information purposes only. Before taking any action on any investment, it is imperative that you consult with multiple properly licensed, experienced and qualified investment advisors and get numerous opinions before taking any action. Your minimum risk on any investment in the world is: 100% loss of all your money. You may be taking or preparing to take leveraged positions in investments and not know it, exposing yourself to unlimited risks. This is highly concerning if you are an investor in any derivatives products. There is an approx $700 trillion OTC Derivatives Iceberg with a tiny portion written off officially. The bottom line:
Are You Prepared?