
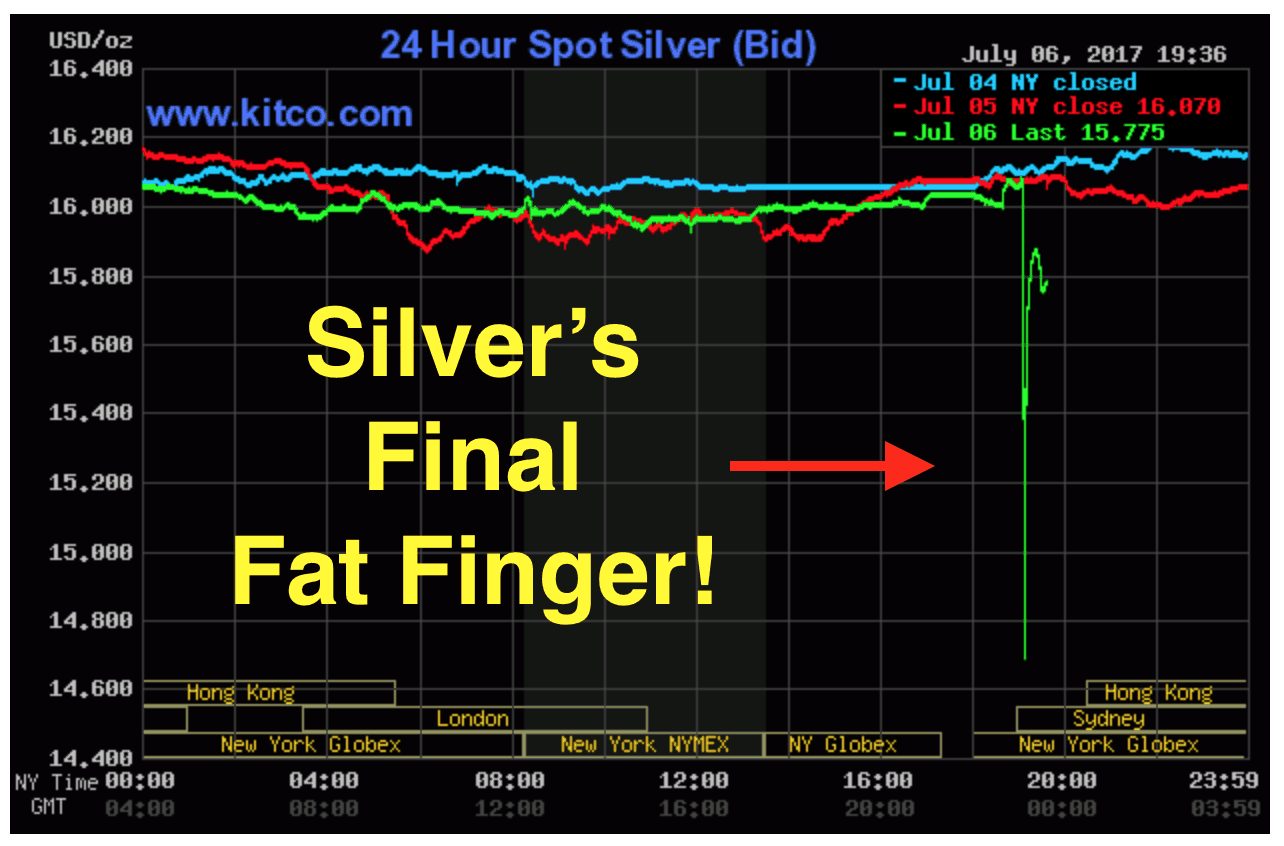
6 July (overnight Friday NZ time) saw some crazy action in silver prices. In a “flash crash” the silver price plummeted from just above $16 all the way down to the low $14’s in just one minute before bouncing back almost as fast and recouping the majority of the fall. Ronan Manly reported on what was going on in the silver futures market:
“During this one minute period between 19:06 NYT and 19:07 NYT, the SIU7 contract saw trading volume of 4954 contracts (the 4.954K in the chart below), with the price falling from a high of 16.065 to a low of 14.34, before ending that minute period at US$ 14.68. The COMEX SI silver futures contract, which is a deliverable contract but which in practice is rarely delivered; is a futures contract for 5000 troy ounces of silver. The 4954 contracts traded during the 1 minute period in theory represent 24.77 million ounces (770 tonnes) of silver and would be valued at $397.8 million at the opening price of US$ 16.06 at 19:06 NYT. Overall within these 4 minutes, more than 8,300 September silver contracts were traded.”
So then the obvious question is what caused the price to drop like a stone? Manly continues (emphasis added is ours):
“What caused this momentary price plummet in the COMEX silver futures is not clear. This is because the CME Group, operator of the COMEX futures platform, has provided no explanation for these price gyrations. Possible causes could include market illiquidity, deliberate manipulation, a trading error or errors, or algorithmic trading programs triggering stop losses or inducing abnormal trading patterns. Until the CME Group releases a statement on this (which it probably won’t), the exact cause of this futures price flash crash remains unclear. What the CME did do yesterday however was as follows: At 19:06:38, the CME systems implemented a 10 second halt in the COMEX silver futures contracts. Within 20 minutes, CME made an announcement in a messaging broadcast that it was reviewing all SIU7 (September futures) trades that had taken place under US$ 15.84 and all SIZ7 (December futures) trades that had taken place under US$ 15.94. After another 20 minutes, CME announced in a messaging broadcast that for SIU7, any trades executed below US$ 15.54 would be adjusted up to US$ 15.54, while for SIZ7, all trades executed below 15.64 would be adjusted up to US$ 15.64. These speedily introduced price adjustments would appear to suggest that the CME Group quickly determined that whatever caused the sharp price falls in the COMEX silver futures prices was not part of normal COMEX futures market trading, and that the CME made the call to back out and cancel at least some of the effects of this abnormal market trading. This would also seem to suggest the CME found evidence of something untoward, either price manipulation, or unfair algorithmic trading, or unjustified stop-loss triggering etc. While these ‘paper’ trading markets in the form of the OTC London silver market and the COMEX futures market unfortunately do have a real impact on the international silver price that is inherited by these physical markets, this latest pricing fiasco on the COMEX again demonstrates that COMEX trading of precious metals futures and London trading of fractionally-backed unallocated precious metals spot and forwards contracts are becoming more and more detached from the underlying reality of the physical gold and silver markets. This also has an adverse effect on investor sentiment in these paper markets and could in time be a trigger for shifting gold price discovery from paper to physical.”
Read more:Gold and Silver Commitment of Traders (COT) Report: A Beginners Guide Not surprisingly Bix Weir believes that price manipulation is the reason for this crash and he pointed out that this could likely be “Silver’s Final “Fat Finger” Manipulation”:
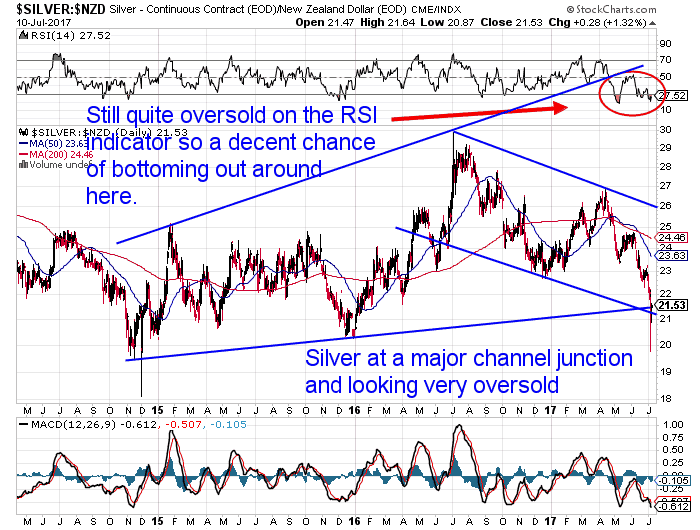
So far silver looks to be holding up well, so he may be right. Since the flash crash silver has moved slightly higher again. In New Zealand Dollar terms silver is sitting right on the intersection of the short term down trend line and the longer term uptrend line. This combined with silver being very oversold on the RSI indicator, means there is a decent chance of silver bottoming out around here finally.
So what looks like an engineered crash could well prove to be the capitulation low in silver. Another point worth considering, if this talk of manipulation and even lower silver prices depresses you, was made by Lynn Fisher:
Keep in mind, if you are of the manipulation mindset, be encouraged that the bullion banks would not be cycling out of massive numbers of short positions if they thought the price was going to go down significantly. One can then rest on the rationale that prices are about to go up. Here is what we DO know for sure. Market manipulations always fail… eventually. The paper markets continue to separate from the physical metals. The backwardation that exists in the metals market has only been furthered by these flash crashes. And remember that patience is a virtue that is rewarded in the physical metals market. I’ll take this opportunity to add silver (still the buy based on the current gold:silver ratio) to my holdings. [If you need an explanation of backwardation means then see this previous article.]
Flash Crash in Gold Too
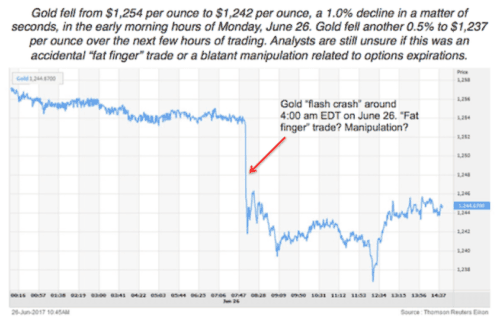
The term “flash crash” has been a common theme lately. June 26 saw a similar occurrence with gold and again to a lessor degree on July 3rd. Jim Rickards writes that the June 26 flash crash was likely created to knock gold call options “out of the money” a day before options expiration”. Interestingly his refining contacts report real tightness in the physical gold market. Perhaps that is referring to very large gold orders? But in the physical retail market there is certainly no shortage of gold available currently. Premiums remain low and so do delivery times. However as he explains, it is certainly still the paper gold market that is setting the price of physical gold…
A Tale of Two Gold Markets
By James Rickards Originally published at The Daily Reckoning In the early morning hours of Monday, June 26, gold fell about 1%, from $1,254 per ounce to $1,242 per ounce, in a matter of seconds. And that the equivalent of 1.8 million ounces of gold were sold at once. The 1.8 million ounce amount is equivalent to about 59 metric tons of gold. That’s about 2% of the entire gold mining production of the world for a full year. No one sells that amount of physical gold. Besides, mining output is almost 100% pre-sold these days, meaning that if you wanted to buy that much gold directly from a mine, you couldn’t do it, because it’s already committed to fulfill existing contracts. Forget about getting gold elsewhere too. The largest gold mining country in the world, China, produces almost 500 metric tons per year. But China also prohibits the export of gold, so you can forget about sourcing physical gold from China. Gold refiners won’t sell you any gold either. The largest refiners are working triple shifts around the clock to meet existing demand. Many refiners are having trouble sourcing gold in the form of doré from mines, scrap jewelry or existing bars to keep their refining operations going. Gold is also leaving the custody of commercial banks and heading to nonbank storage at secure logistics providers such as Loomis and Brinks. These transfers do not change the total supply, but they do diminish the floating supply available to support the leveraged paper gold products offered by London Bullion Market Association dealer banks. In effect, more and more paper gold is poised on top of on an inverted pyramid with less and less physical gold at the base. All of this information about acute shortages of physical gold relative to demand is well documented. In addition, I have gathered a large body of firsthand confirmation of these facts. In the past year I have visited gold vaults in the U.S., U.K., Australia and Switzerland. I have visited gold refineries in Switzerland. I have visited gold mining operations in Canada and the U.S., and I have met with major bank and nonbank gold dealers in the U.S., U.K., Canada and China. Everywhere the story is the same. Physical gold is scarce, difficult to source and already spoken for when you can find it. Meanwhile, demand for physical gold remains robust. I met with the heads of gold dealing for two of the largest banks in China, ICBC and UOB. They both told me that demand for physical gold among Chinese retail buyers is strong, despite some reports to the contrary.

Your correspondent standing on the Bund, a waterfront thoroughfare along the Huangpu River in Shanghai, China, during a recent visit. Behind me is the original headquarters building of the Hongkong and Shanghai Banking Corp. (now HSBC), built in 1923. While in Shanghai, I met with the heads of gold trading for two of the largest banks doing business there, ICBC and UOB. Both reported that supplies of physical gold were tight and demand remains high despite some reports to the contrary. A gold refiner in Switzerland told me, “Jim, if you called to buy gold and I did not know you personally, I would not even return the call. We have none available.” With that as background to the physical supply-and-demand situation, why is the price of gold not soaring? That’s how markets usually respond to tightness in supply. A higher gold price would encourage more mining (although new mines take five–seven years to actually produce gold), which would increase supply and equilibrate markets at a new higher price point. The answer is that there really is no true market for gold, just a rigged game consisting of physical gold and paper gold trading side by side as if they were one and the same. They’re not. The June 26 flash crash in gold is a good case in point. If I sold 59 tons of physical gold short and had to make good delivery, I couldn’t do it, nor could a bullion bank or dealer. Given the situation I described, you’d be lucky to source 5 tons in 30 days; even that would be difficult for anyone other than JPMorgan or HSBC. I would ultimately default on the contract and face a lawsuit for contractual damages and possible fraud charges. But in the paper gold world, it’s not a problem. You just pick up the phone, put the order in to your broker, post a relatively small margin amount (maybe $100 million on a $2 billion short sale, or 5% of the notional contract value) and you’re done. You’ve just destroyed the price of gold with no actual gold involved. Futures markets exist ostensibly for hedging purposes, but it’s difficult to see why any commercial player would need to hedge 56 tons all at once. (By the way, orders of that size are usually “worked” over days or weeks. That avoids exactly the kind of market impact seen in this case, which hurts the hedging party because they get a lower price.) Futures markets also allow speculation, which is considered to add liquidity and enable legitimate price discovery. But there’s a fine line between legitimate speculation and outright manipulation, which is fraudulent. The difference between legitimate speculation and fraudulent manipulation is often difficult to prove, because it requires some finding of “intent” in the mind of the manipulator. That can be elusive unless there is a smoking gun email or other written evidence. In some ways, this doesn’t matter, because regulators have shown no appetite to enforce the law. The message to manipulators is that this is a big boy’s market and players can do whatever they want as long as it’s not too blatant.
There is a lot of speculation about the actual motive of the flash crash paper gold short seller. Was this a so-called “fat finger” trade where the trader made a mistake by entering the wrong quantity or pushing the wrong button? That’s possible, but a more nefarious explanation comes to mind. Paper gold trades not only as futures and bank forwards, but also as options on futures. The flash crash happened the day before an important expiration date in the options market. Was a seller of call options at, say, $1,245 per ounce trying to sink the price the day before expiration in order to avoid a $10 per contract loss? That’s entirely possible, even plausible. We’ll probably never know, because enforcement in this area is almost nonexistent. One of the most frequently asked questions by gold investors is, “Why should I invest in gold if the price is just going to get slammed by paper gold sellers with no actual gold? What’s the point?” More broadly, where does the price of gold go from here? The most important signal is that gold’s uptrend, which began on Dec. 15, 2016, remains intact. Even after the flash crash, gold remains just a bit below the previous low of $1,210 per ounce on May 10, 2017. That means gold is set for a rally above $1,300 per ounce, which would exceed the prior high of $1,293 per ounce on June 6. The next powerful indication is the marked slowing of the U.S. economy in reaction to rate tightening by the Fed. This is showing up in auto sales, retail sales, disinflation, lower labor force participation and many other indicators. The result of this slowing will be that the Fed will have to reverse course and use “forward guidance” to signal that they will not hike rates in September. That’s a form of ease that will lower the dollar index and raise the dollar price of gold. Finally, investors can take comfort from the fact that all manipulations fail in the long run. Whether it’s the “gold corner” of 1869, the “gold pool” of 1968, Kissinger’s secret “gold dump” of the late 1970s, or “Brown’s bottom” (when the U.K. sold most of its gold at 30-year low prices) of 1999, or the more recent gold games on the Comex, all manipulations fail. Gold prices always find their way higher, because paper currencies always lose value over time. The key response functions to manipulation are patience, confidence in the long-run path of gold and nimbleness in stepping up to buy gold at interim lows when manipulation gets out of hand, as it just did. The gold rally that began on Dec. 15, 2016, is poised to continue despite the trauma of the flash crash. The crash represents a gift to investors. We now have a better entry point for what will still be much higher gold prices later this year. Regards, Jim Rickards for The Daily ReckoningAbout James Rickards: James G. Rickards is the editor of Strategic Intelligence, the latest newsletter from Agora Financial. He is an American lawyer, economist, and investment banker with 35 years of experience working in capital markets on Wall Street. He was the principal negotiator of the rescue of Long-Term Capital Management L.P. (LTCM) by the U.S Federal Reserve in 1998. His clients include institutional investors and government directorates. His work is regularly featured in the Financial Times, Evening Standard, New York Times, The Telegraph, and Washington Post, and he is frequently a guest on BBC, RTE Irish National Radio, CNN, NPR, CSPAN, CNBC, Bloomberg, Fox, and The Wall Street Journal. He has contributed as an advisor on capital markets to the U.S. intelligence community, and at the Office of the Secretary of Defense in the Pentagon. Rickards is the author of The New Case for Gold (April 2016), and three New York Times best sellers, The Death of Money (2014), Currency Wars (2011), The Road to Ruin (2016) from Penguin Random House. Read more:Paper gold or Physical Gold Which Should you Buy?
Pingback: Paper Gold vs Physical Gold - What Should You Buy? - Gold Survival Guide