Prices and Charts
Is Gold Bottoming?
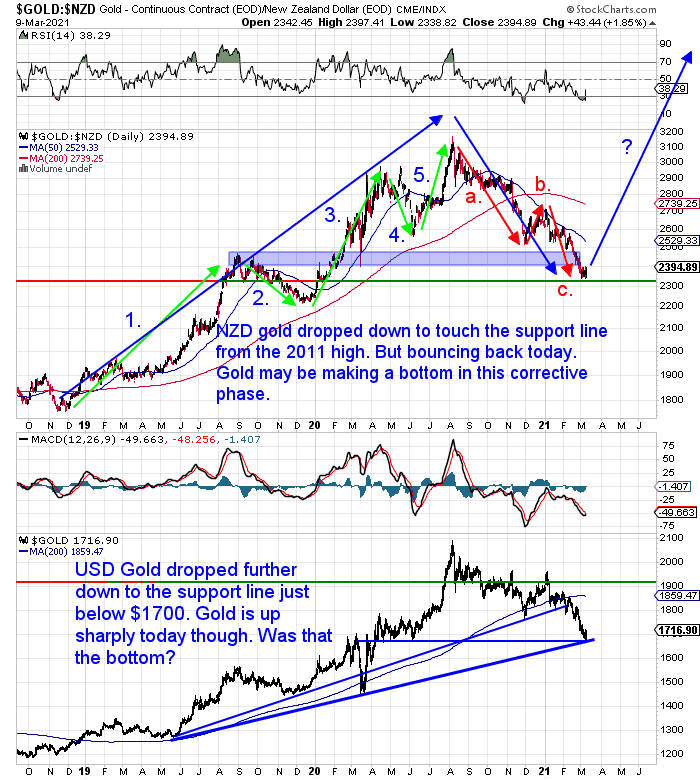
During the past 7 days, gold in New Zealand dollars dropped down to touch the support line dating right back to the 2011 highs. But it has bounced back sharply today to be up about three quarters of a percent.
Gold may well be making a bottom in the middle down wave of the Elliott Wave Theory formation we outlined last week.
Our feature article this week has heaps of charts so we’ll leave you to read that for more on where to from here for gold (and silver).
Silver May Have Made a Higher Low
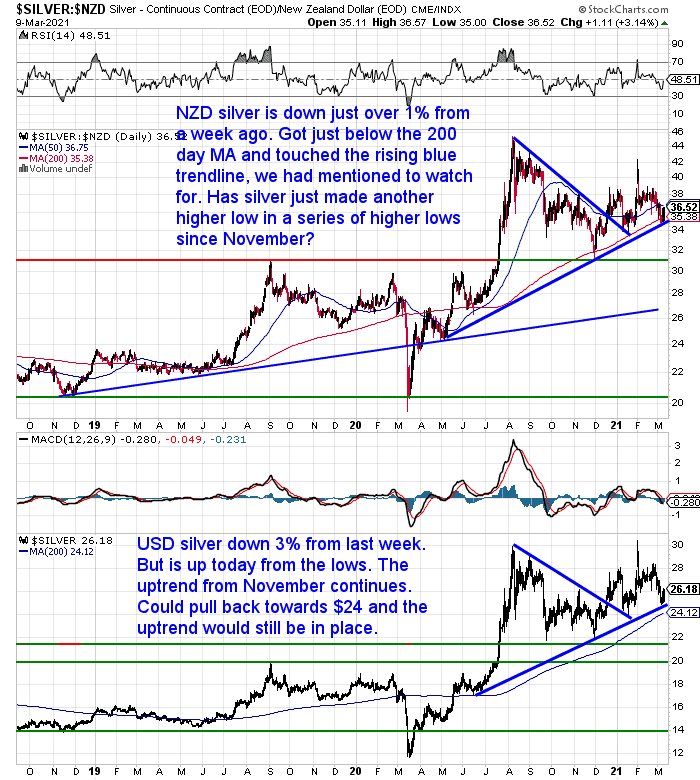
NZD Silver is down just over 1% from a week ago. It got just below the 200 day moving average (MA) and touched the rising blue trendline, before bouncing back sharply today.
Has silver just made a higher low in a series of higher lows since November?
NZ Dollar Down 1.75%
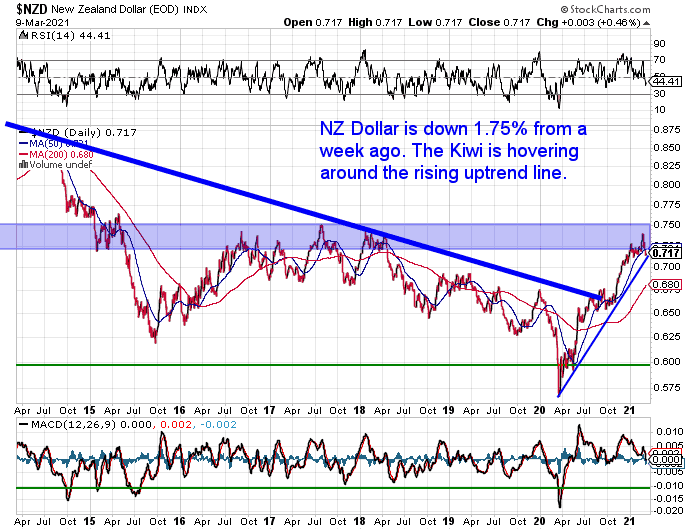
The Kiwi dollar is down 1.75% from a week ago. It’s hovering around the rising trendline. Tough to say which way from here now.
Need Help Understanding the Charts?
Check out this post if any of the terms we use when discussing the gold, silver and NZ Dollar charts are unknown to you:
Continues below
—– OFFER FROM OUR SISTER COMPANY: Emergency Food NZ —–
NEW: Certified Organic Long Life Emergency Food
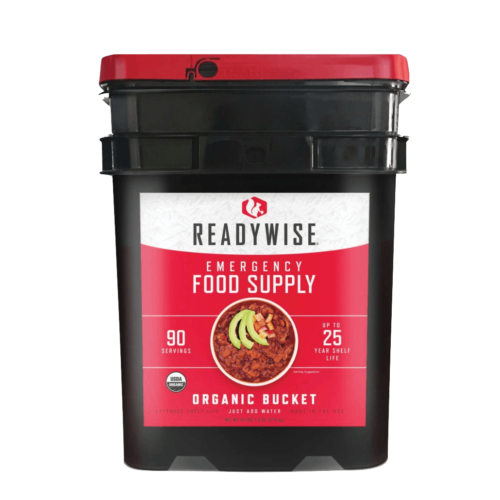
This easy to carry bucket has 90 servings of organic breakfasts and mains
Free Shipping NZ Wide
Get Peace of Mind For Your Family NOW….
—–
Have Silver and Gold Bottomed? What’s Next for Gold and Silver in NZ Dollars?
Gold and silver have been falling recently. And gold has been falling for longer than silver. So today we look at whether gold and silver in New Zealand dollars may be about to bottom. Then we look at what’s next for gold and silver in NZD…
You’ll see:
- Why Have Gold and Silver Been Falling?
- Where to From Here for Silver in NZD?
- How About the Yellow Metal? What’s Next for Gold in NZ Dollars?
- Major Horizontal Support Line Holding
- Relative Strength Indicator (RSI)
- Weekly Chart Also Oversold and Touching Support Level
- Monthly Chart
- Fibonacci Retracement
- Elliott Wave Theory
- Final Positive (and Contrarian) Indicator For Buying Gold and Silver Now

Silver Coin Winner for February
It was brought to our attention that we hadn’t been advising people of the winners of our monthly coin question (thanks Dennis S.) For privacy reasons we won’t list the winners full name, just their first name and the initial of their last name.
The winner for February was Phil I.
His question was:
“I confess, lm confused as to how there is such a fluctuation in the value of gold.
When I bought my first house, new, in 1961 it cost £3500.
So why would it cost so much more in gold now?
I’ve seen graphs and can’t remember the Oz of gold.
But allowing for an increase in land values, it should still be about the same, in gold.
I think.”
This is something that many people have trouble getting their head around.
Here’s our reply:
“Hopefully we can shed some light on it for you.
When you say:
“I bought my first house, new, in 1961 it cost £3500.
So why would it cost so much more in gold now?”
The chart we have in this post might explain this the best, as by coincidence it goes back to about 1962: NZ Housing to Gold Ratio Update
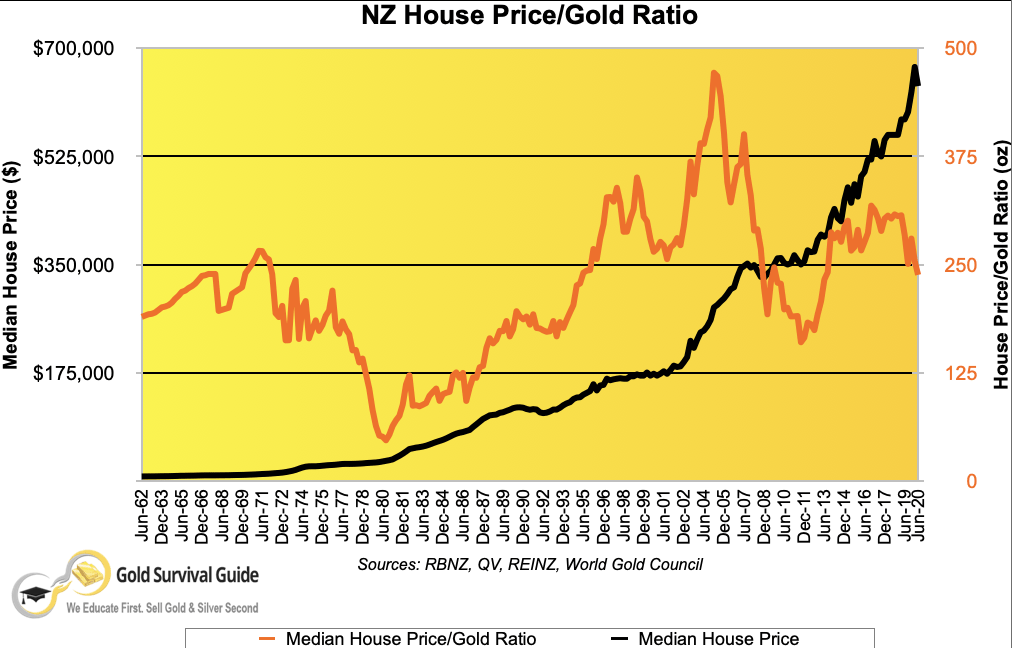
In the early 1960’s the median priced house in NZ was valued in the low thousands – see the black line. About in line with your 3500 pounds most likely.
But if we look at the orange line that is how many ounces of gold it took to buy this median priced house. That appears to be somewhere around 180 ozs.
Fast forward to today (well last year at least) and this per oz price is around 250 ozs of gold to buy the median house. So yes it does take more ounces of gold to buy the same house today.
When you wonder why “there is such a fluctuation in the value of gold”, yes it has fluctuated since the 1960’s in terms of how much housing an ounce would buy. But what this is showing is that gold remains undervalued in comparison to real estate. Or you could say housing is overvalued compared to gold. As the above article explains, we may see a return to below 100 ounces of gold to buy the median house when the current bull market in gold is over.
However in comparison to dollars gold has been very stable against housing. it’s actually the dollar that is fluctuating so much. As it now takes somewhere close to $500,000 to buy the median house.
Hopefully that helps to clarify it for you.”
Got a question? Send it in. We can’t promise we’ll answer, but we’ll pick a winner at the start of every month and publish it in this weekly newsletter.
Your Questions Wanted
Remember, if you’ve got a specific question, be sure to send it in to be in the running for a 1oz silver coin.
Gold – a Leading Indicator for Bond Yields Topping Out?
Peter Spina from the excellent news site GoldSeek shared this tweet a few days ago. It postulates that gold may be a leading indicator for bond yields to peak. In the past the Philadelphia gold mining index (XAU) has bottomed around 6 weeks ahead of when the yield on the US government bond yield tops.
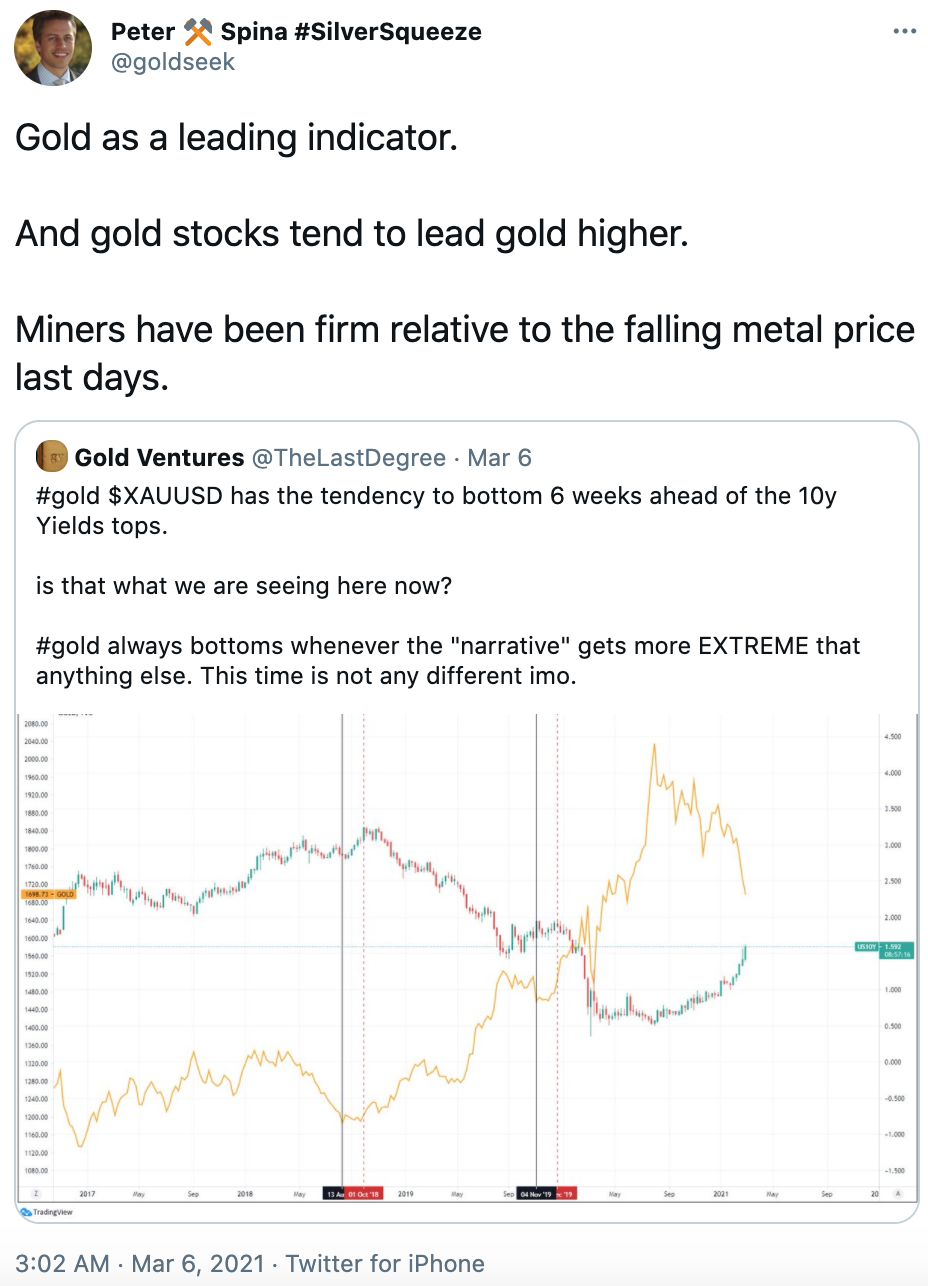
Source.
Further evidence on top of the indicators we discuss in this week’s feature post. Making now likely to be a pretty good time to be buying gold (and silver) compared to the months and years ahead.
Get in touch if you have any questions about buying…
- Email: orders@goldsurvivalguide.co.nz
- Phone: 0800 888 GOLD ( 0800 888 465 ) (or +64 9 2813898)
- or Shop Online with indicative pricing
— Prepared for the unexpected? —
Here’s how to always have clean fresh drinking water on hand.
The Sport Berkey Water Filter Bottle – $69 Delivered
Ideal for travel. Driving, camping, backpacking.
Free Shipping NZ Wide.

—–
|