Why the 2025 Dip May Be Normal — and What to Watch Next.
After soaring to an all-time high above US$3,500, gold has pulled back — and with it, headlines declaring a possible top. But this gold correction in 2025 looks more like a breather than a breakdown. With strong fundamentals, continued central bank demand, and support zones holding, this may be the start of a healthy consolidation — not the end of gold’s run.
👉 Here’s what we’ll cover in this week’s analysis:
Table of contents
- Why the 2025 Dip May Be Normal — and What to Watch Next.
- 1. Why Gold Surged — And Why It Had to Pause
- 2. Gold Support Zones and Technical Signals: What the Charts Are Showing
- 3. Asia’s Gold Demand Shows No Signs of Slowing
- 4. The Big Picture Case for Gold Is Still Intact
- 5. What We’re Watching — and What to Do Now
Estimated reading time: 6 minutes
1. Why Gold Surged — And Why It Had to Pause
Gold’s rally since late 2023 was broad-based. Central banks were buying at record levels, the U.S. bond market was showing signs of strain, and inflation remained sticky.
👉 We explored these themes in Why the World Is Losing Faith in US Treasuries — And Turning to Gold, where we showed how bond market volatility was driving capital into bullion.
Technically, gold got stretched. Traders piled in, momentum surged, and prices broke through level after level — until they reached US$3,500.
But as Chris Weber wrote in his latest Weber Report, this kind of parabolic move can’t last forever:
“Consolidation, range-bound, or correction are different names for the same thing. A period to catch one’s breath.”
Sentiment had gotten a bit frothy. Investors with no previous interest in gold had suddenly become aware of how much it had risen. We’ve had many people asking us, “how is business?” Logically assuming we would be very busy because of the high price (we’re not). That kind of behaviour often signals a short-term top, but not the end of a bull market.
Weber suggests a 10–20% pullback in gold would be normal, with strong trend support around $3,150 to $2,800.
In short: this looks like a classic gold correction in 2025, not a collapse.
2. Gold Support Zones and Technical Signals: What the Charts Are Showing
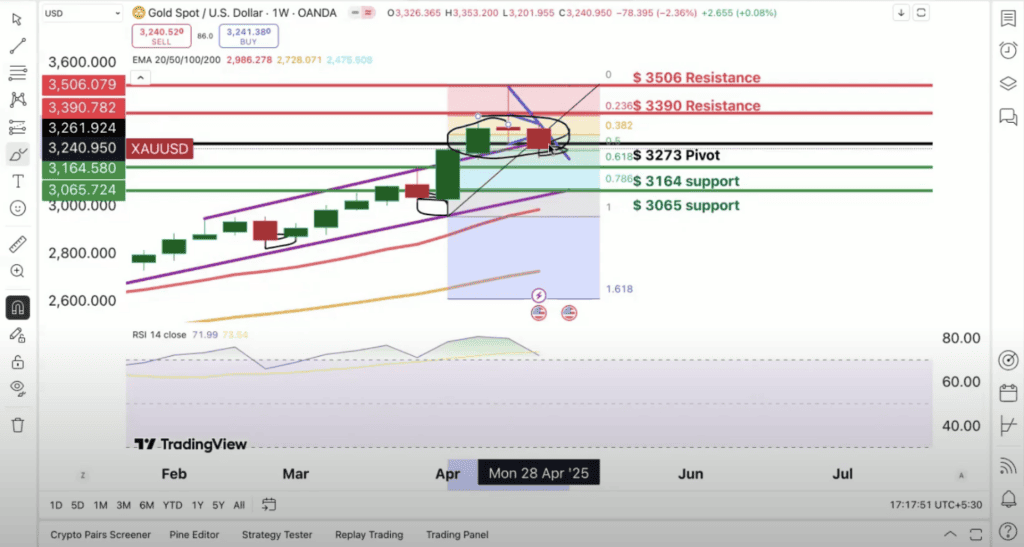
On the daily chart, gold is now retracing into key technical levels. FinMet’s Shawn Fernandes highlights the Fibonacci retracement zones between $3,164 and $3,065 as likely support.

Meanwhile, the weekly chart has formed an Evening Star candlestick — a signal of temporary exhaustion, not necessarily trend reversal. And short-term charts show gold trading below its moving averages, but with indicators like RSI and MACD resetting.
These are typical signs of a pullback within an uptrend — especially after a strong, momentum-driven breakout.
Even now, gold is still up around 20–25% year-to-date, outperforming nearly every other major asset class. That’s hardly bearish.
While short-term support sits near $3,065–3,100, even a deeper pullback would likely remain within the bounds of a healthy longer-term uptrend.
These insights come from a recent discussion on the FinMet channel featuring Shawn Fernandes and Ronan Manly, which covers both technical and macro drivers behind gold’s current move. You can watch the full video here:
📺 AKSHAYA TRITIYA UPDATE: Gold Price Outlook for This Week
3. Asia’s Gold Demand Shows No Signs of Slowing
While Western traders focus on charts, demand in Asia remains strong.
In India, the Akshaya Tritiya festival saw long queues at gold shops, despite rupee prices near record highs.
In China, the story is more technical — but just as telling. As Ronan Manly explained in the video above, recent margin hikes on the Shanghai Futures Exchange (SHFE) and other Chinese exchanges triggered a short-term flush-out of leveraged traders. These adjustments, coinciding with China’s May Day holidays, likely contributed to gold’s recent dip.
But as FinMet explained, this was positioning — not panic. Once volume returns and margins ease, demand could rebound quickly (this seems to be happening already as we write).
The Reserve Bank of India remains a steady gold buyer. China’s central bank also added to its gold reserves again in April, marking 18 consecutive months of accumulation.
This builds on last week’s post: Parabolic Gold: Why It’s Just the Start — Not the End. That article showed how the rally was being driven by sovereign buyers, central banks, and Asian investors — not hype.
Those long-term buyers haven’t disappeared. They’re likely waiting patiently beneath the noise of short-term charts.
4. The Big Picture Case for Gold Is Still Intact
Underneath this 2025 gold correction, the same long-term forces are still at play.
- The U.S. is running structural deficits
- Inflation remains sticky
- Central banks globally are buying gold at the fastest pace since the 1960s
- The Federal Reserve is still expected to cut rates later this year
- Even while the US faces a recession risk
These aren’t short-term noise — they’re long-term signals. And they’re the same ones that helped gold break out in the first place.
Even the IMF recently warned that volatility in sovereign debt markets and leveraged asset managers could create instability. Against that backdrop, gold remains the ultimate hedge.
Want to understand how high gold could go? Read:
👉 How Do You Value Gold — What Price Could It Reach?
5. What We’re Watching — and What to Do Now
Corrections often feel uncomfortable — but they’re part of every major bull market. Gold’s rally in 2025 has been steep and fast. Now, it’s pausing — not collapsing. That’s a normal and even healthy phase in a long-term trend.
Right now, here’s what we’re watching:
- $3,164 and $3,065 remain the nearest technical support zones
- Momentum indicators like RSI and MACD are resetting
- A break back above $3,200 could signal renewed strength
If gold can stabilise above $3,100 or reclaim $3,200, the shorter-term (and steeper) 2025 uptrend remains intact. However, even with a drop as low as $2,850, or to the 200-day moving average near $2,750, the broader structural bull market is still very much in play.
[Update: As we hit publish on this article, gold has indeed bounced back above these key levels (see below chart). With China returning from holiday gold is currently sitting at $3,359. So the steeper uptrend continues.]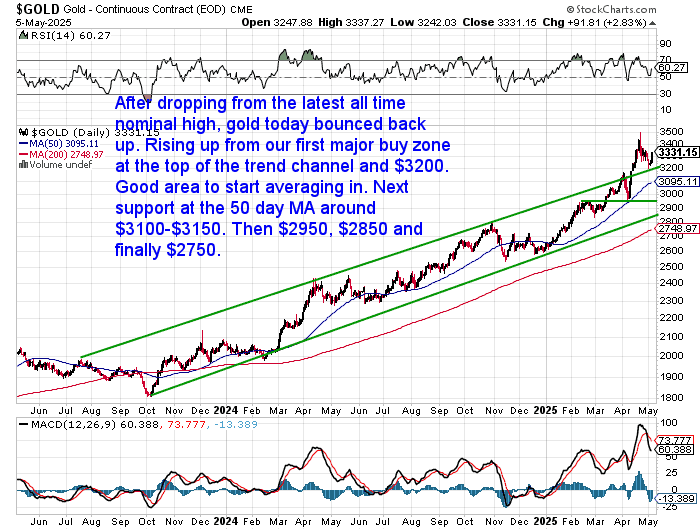
So what should investors do?
- Already holding gold? This is more likely a breather than a breakdown. Stick to your long-term view.
- Still waiting to enter? Short-term weakness often creates the best opportunities. Consider scaling in.
- Watching silver instead? With the gold/silver ratio still above 100, silver remains extremely undervalued. History shows silver tends to play catch-up when gold cools.
👉 Read more in:
Gold Silver Ratio 2025: Is Silver Undervalued Again?
📥 Want updates like this every week?
👉 Join our free newsletter