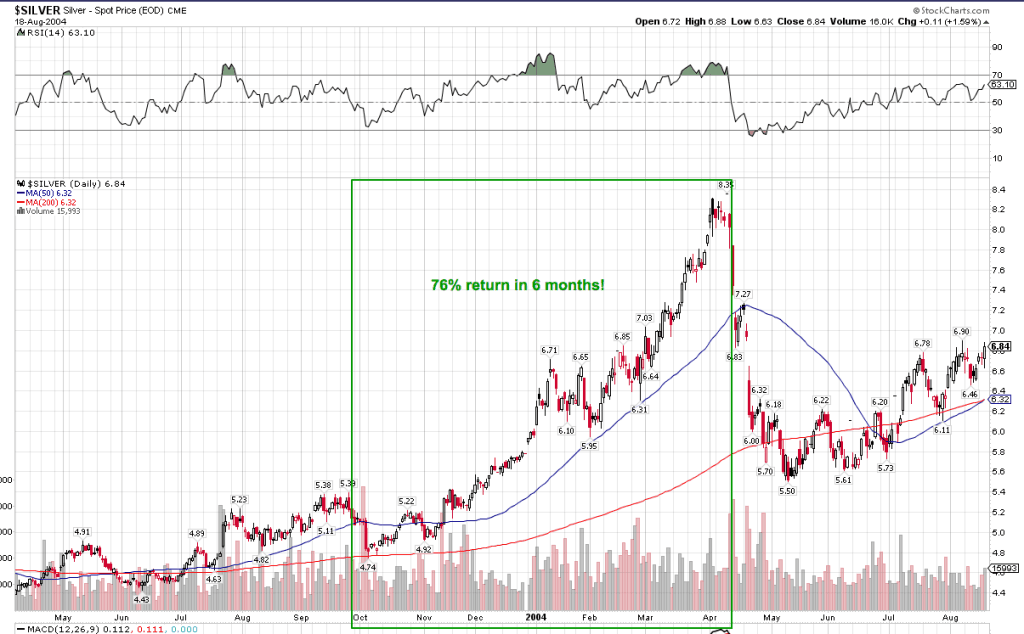
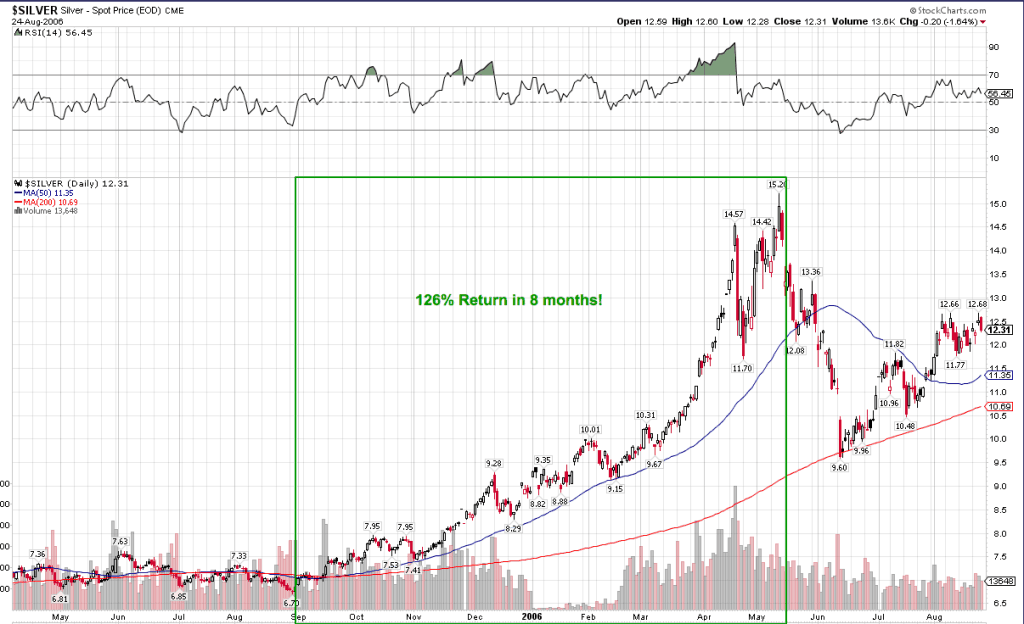
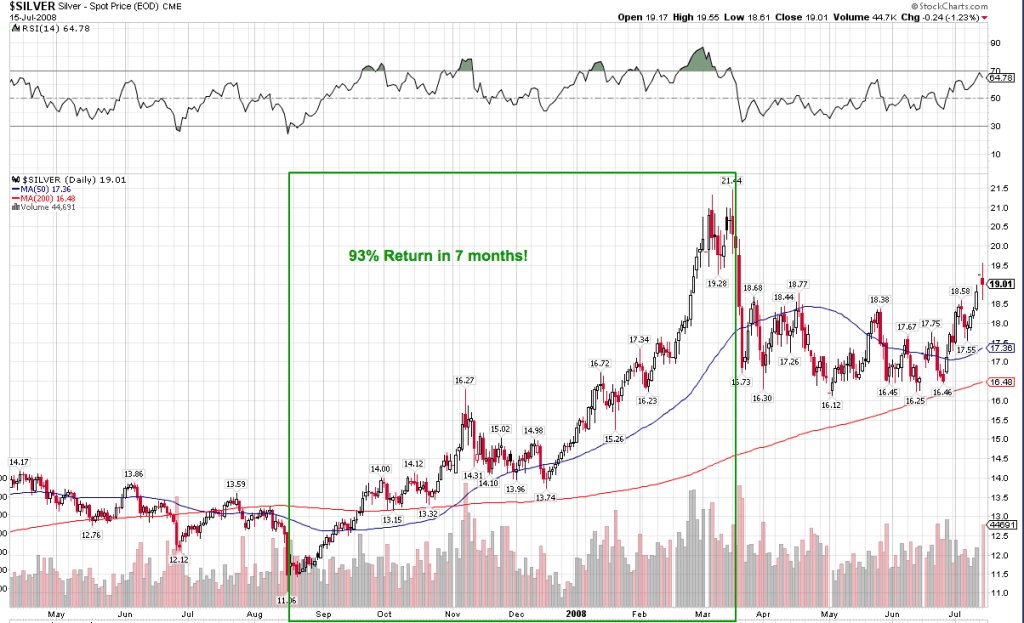
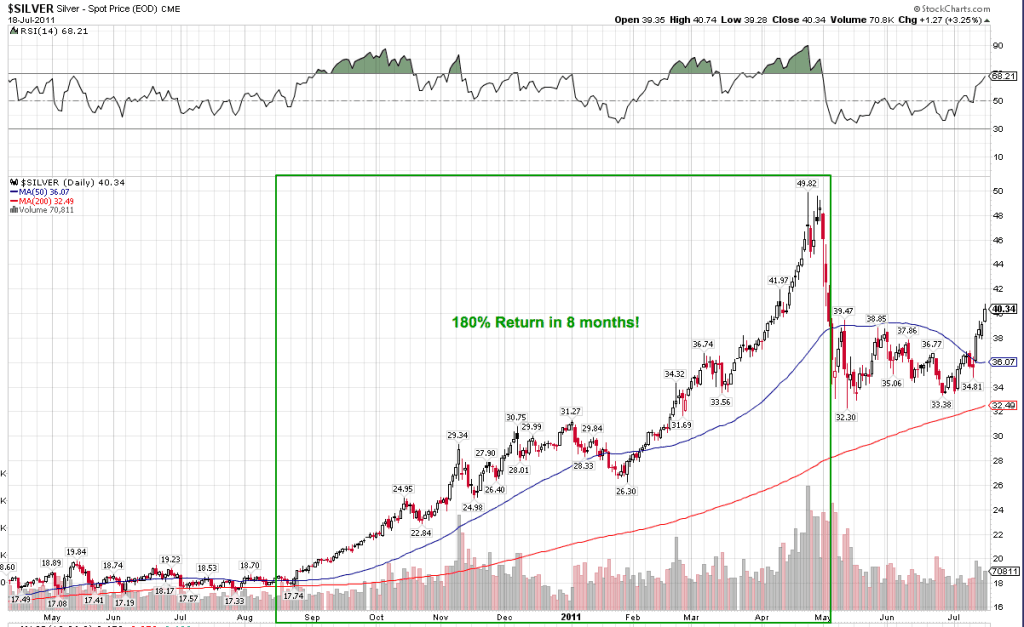
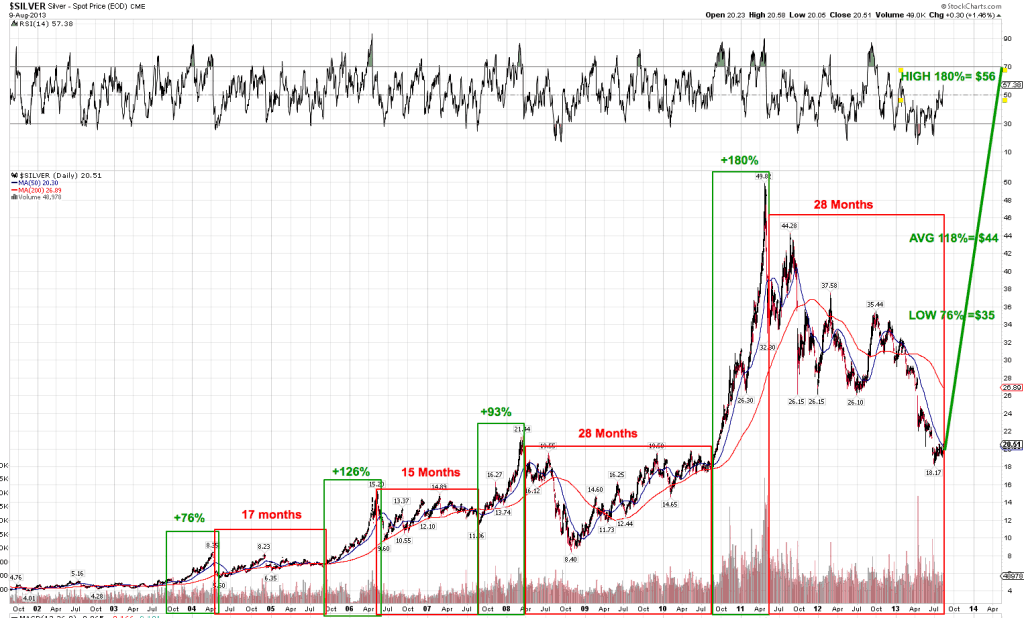
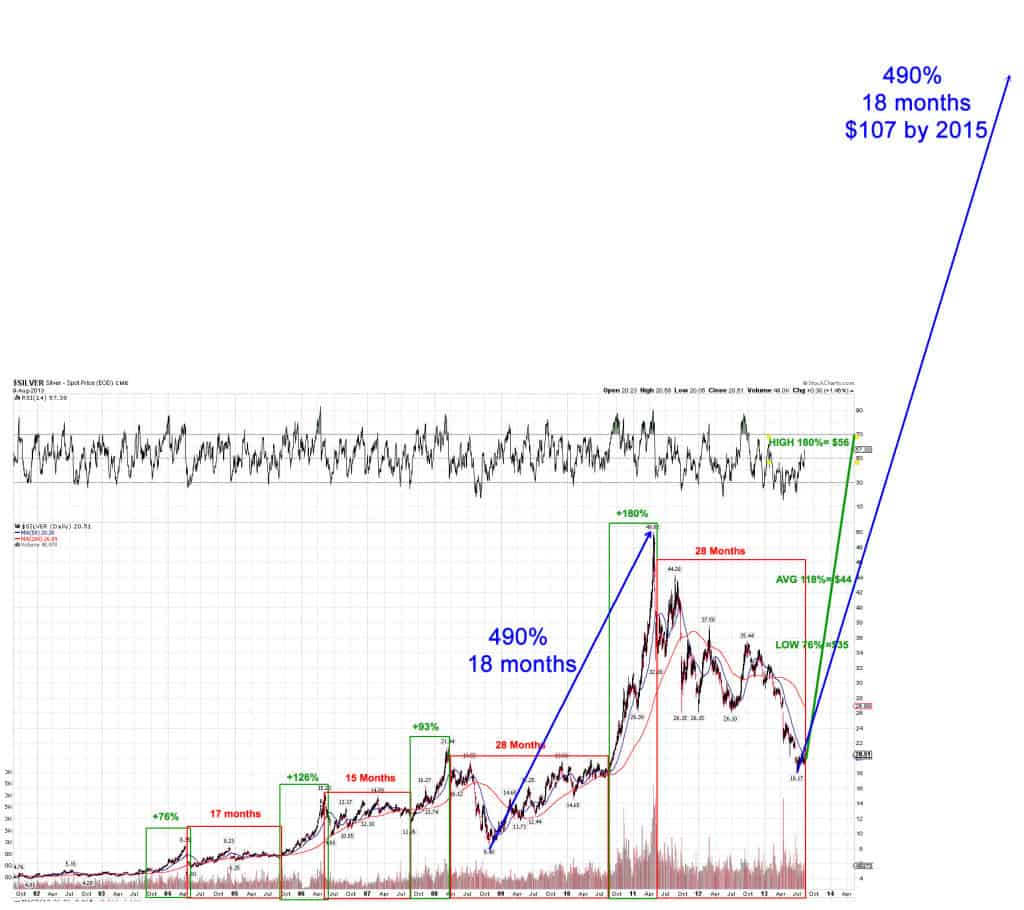
In his latest video Chris Duane, of Silver Bullet Silver Shield and Don’t Tread on me blog, looks at past moves higher in silver from lows to highs and this throws up some interesting numbers. When rising to a new high the percentage gain has risen fairly steadily with each new wave up. The lowest gain in one of these moves up has been 73% and highest 180%.
He is confident that we are now in the new wave up and has made some projections as to where the price might go based upon the percentage gains that have occurred previously in 2004, 2006, 2008 and 2011.
When looking at the movement from the low to the new high the numbers are even bigger with the move from the 2008 low of $8.40 to the 2011 high of $49.82 being 590%! The charts presented in the video are also reproduced below to make it easier to refer back to them.
These are all in USA dollar terms so the numbers will be different when done in NZ dollars but nonetheless give an indication of the potential in silver. Of course as holders of silver over the past 2 years have learnt, the movements down can be just as great. However as you can see in the 2nd to bottom chart of the 6 charts below we are currently still close to the lows of June so in the long run this could well be a solid entry point.
http://www.youtube.com/watch?v=pTJqD1ZM2QY


Pingback: Gold Prices | Gold Investing Guide Why are US Bonds being sold?