Here’s an excellent summary of what could be in store for silver in 2018 and into the following few years.
Including a look back at past silver cycles and what that might mean for the next cycle. What some objections to this outcome might be. Plus what some possible “black swan” events could do to the silver price…
Silver: 2018 and Beyond
By Gary Christenson
Published at SilverSeek.com
Do you appreciate the beauty of silver coins? Do you understand the necessity for silver in our modern world?


American Silver Eagle coins and Canadian Silver Maple Leafs represent value, history, and ownership of an industrially important metal that has been money for thousands of years.
Silver for 2018
Governments and central banks inevitably inflate the supply of currency units (devaluation) more rapidly than the underlying economy grows. They add to the unpayable debt load, pretend $230 trillion in global debt is normal, reduce the value of existing dollars, (euros, yen, pounds) as they create more currency units, and support the narrative that “all is well.”
We know better. Prices for food, rent, beer, medical care, drugs, transportation and nearly everything except computers and televisions rise every year. Silver sold for $4 in 2001 and almost $50 in 2011. Today silver sells for only $17. That will change.
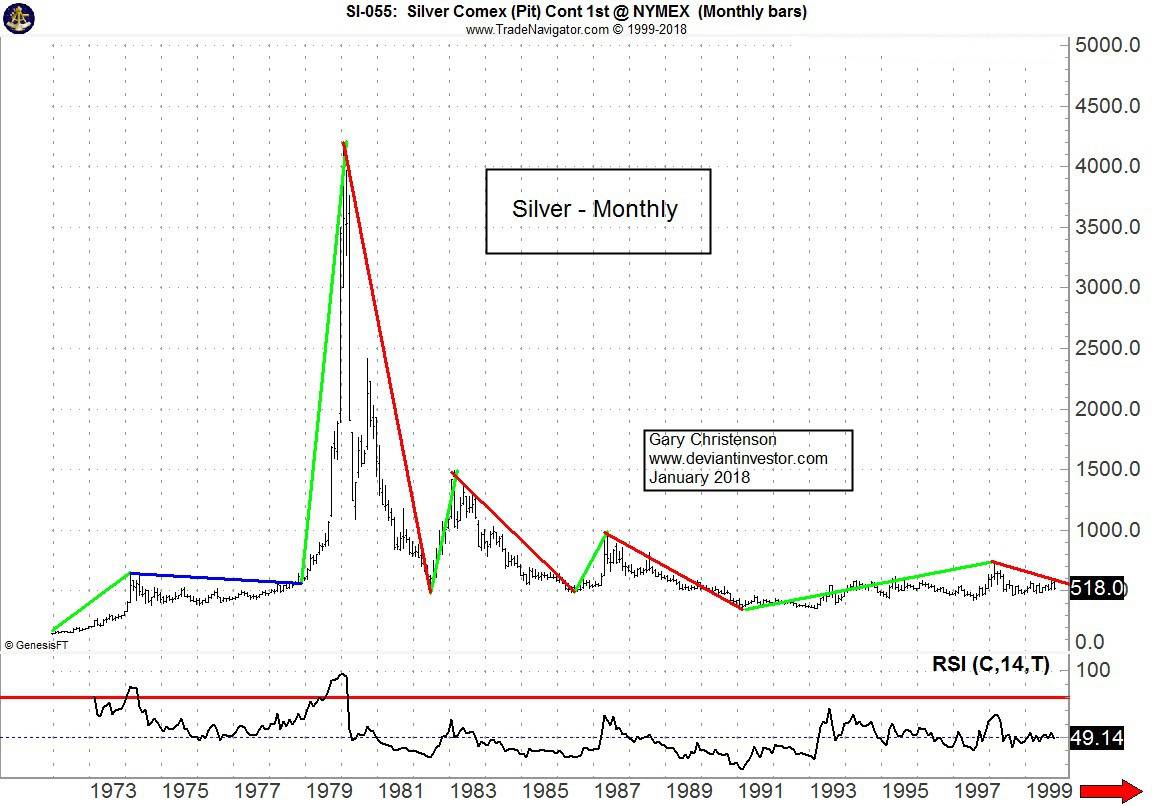
Examine the historical price record for silver since the early 1970s.


Ignore the short-term variations in prices and examine the big moves.
- – Prices ran up into early 1980, down for two years, remained more-or-less flat for 19 years, and moved up and down since the “War on Terror” began
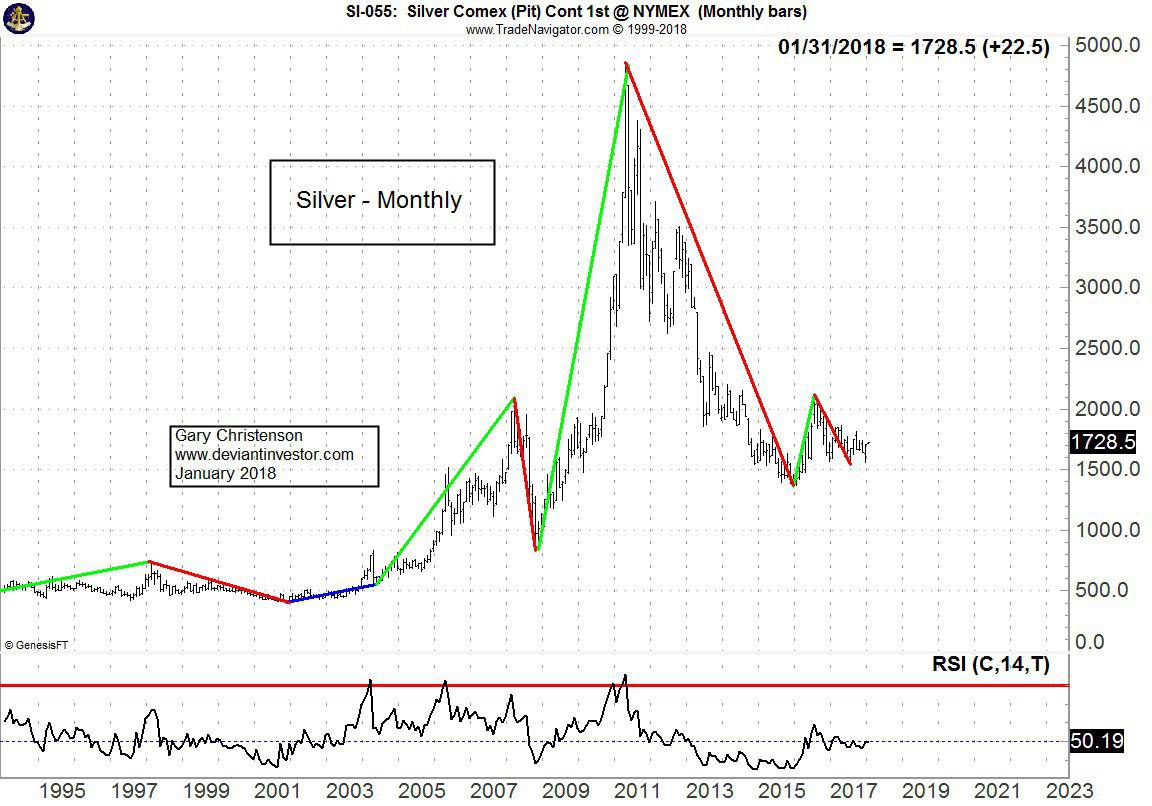
- – Or, a more detailed record (my interpretation) is shown by:
Up – green lines (nine rallies)
Down – red lines (eight corrections or crashes)
Flat – purple lines (two periods of little change)
Observations:
- – Silver prices bubbled higher in the late 1970s, corrected or moved little for 20 years, bottomed about 9-11 (September 2001), rose rapidly for ten years, and corrected since then.
- – The bigger the bubble, the deeper the crash and the longer the correction. (Stock market investors, take note!)
- – The up, down and flat moves are instructive. The lines as drawn are sensible but subjective. Others might define them differently.
In round numbers, the 19 periods (since 1972) described above show:
- – Silver prices moved upward for approximately 2.5 years during rallies and quadrupled from their starting point before correcting.
- – Prices fell for about 2.5 years during corrections and bottomed with an average of 60% losses from the peaks.
- – Prices were flat – twice for about four years each.
Recent History
Silver prices bottomed in December 2015 at $13.61, again in December 2016 at $15.65, and last December at $15.60.
A typical rally, if similar to the above nine rallies (green lines) since 1972, would push silver prices to about $60 in two to three years, say 2020, with wide time and price variation possible.
Objections to this Scenario
- All-time highs seem distant. However, the silver price in 2009 was under $13, and yet prices touched $48 in 2011. In a few years $50 to $100 is likely.
- All the speculative froth has gone into Bitcoin and other cryptocurrencies. The silver market is dead. Not a chance! Modern life, medicine, and technology depend upon silver. Can you say the same for Bitcoin?
- Central bankers, the government, the COMEX, and JPMorgan will never allow silver to rise to all-time highs again. Nonsense! Central bankers will weaken the dollar to minimize the coming recession, governments will obsess over larger issues, COMEX will become less relevant as physical silver markets overwhelm paper markets, and JPMorgan would love to see their half billion ounces of silver bullion (per Ted Butler) rise in price. Yes, much higher prices are not only possible, but likely.
- Silver at $50 is too big a move. Not true! Consider Apple stock in 2009 at $10.01. Today $170. Amazon stock in 2008 at $35.00. Today $1,450. Bitcoin in January 2017 $800.00. It peaked near $20,000 in December of 2017. The world changes, but silver is necessary, more expensive to mine, and critical for high-tech, medical uses, and future power generation. Dollars will disappear long before silver is forgotten.
Big Picture Charts:
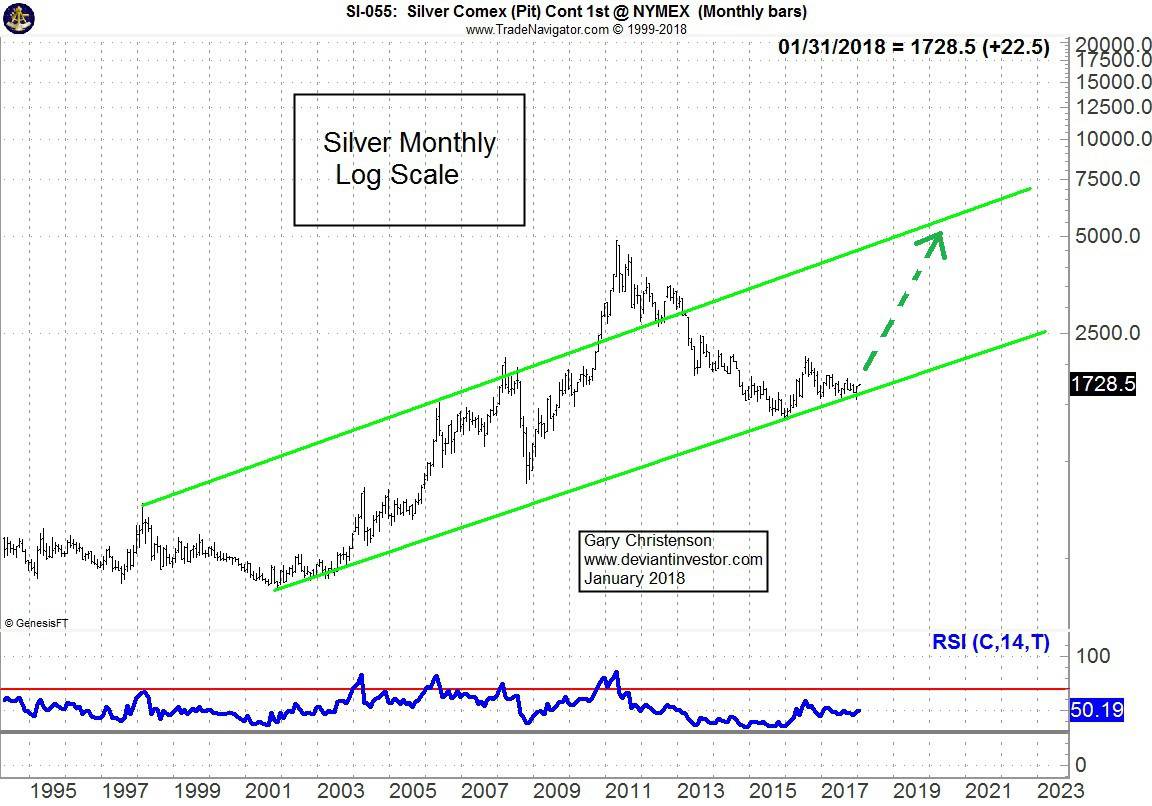
Examine silver prices on a log-scale chart for 25 years.

The green (log-scale) channel has contained prices, except for the 2011 spike higher, since 1997. Can prices fall from here? Yes, and Congress could also balance the budget. Not likely!
Prices are creeping higher along the bottom of the channel. Expect much higher prices, unless you anticipate global debt reduction, sensible spending limits by governments and honest politics.
Prices could run well beyond $50 in 2020 – 2022 and not violate the channel. Exponential increases in debt, currency in circulation, government spending, and national debt CREATE exponential increases in silver and gold prices. The green lines show the exponential trend channel.
The above trend channel shows the “more of the same” scenario for the next decade. That includes:
- The Dollar remains the global reserve currency. (Maybe.)
- Out-of-control spending and debt increases are no worse than during the past 20 years. (Doubtful.)
- Wars are curtailed and few new wars begin. (Doubtful.)
- Government and the Federal Reserve do nothing stupid with debt, spending, Quantitative Easing, Universal Basic Income, “Helicopter Money” and interest rates. (Unlikely.)
And If a Black Swan Lands and Disrupts a Fragile Financial System…
Expanded wars.
- – Expanded wars.
- – New wars. There are many possibilities!
- – Negative interest rates, massive “money printing,” Universal Basic Income, and more government “stimulus.”
- – Another 2008 style credit crunch happens. Central banks respond with QE4,5 and 6 or equivalent.
- – Treasury 10 Year Note yields spike higher. (already happening)
- – Silver and gold are priced on physical (not paper) exchanges. COMEX and LBMA paper become less important. Read Keith Neumeyer and the end of manipulation.
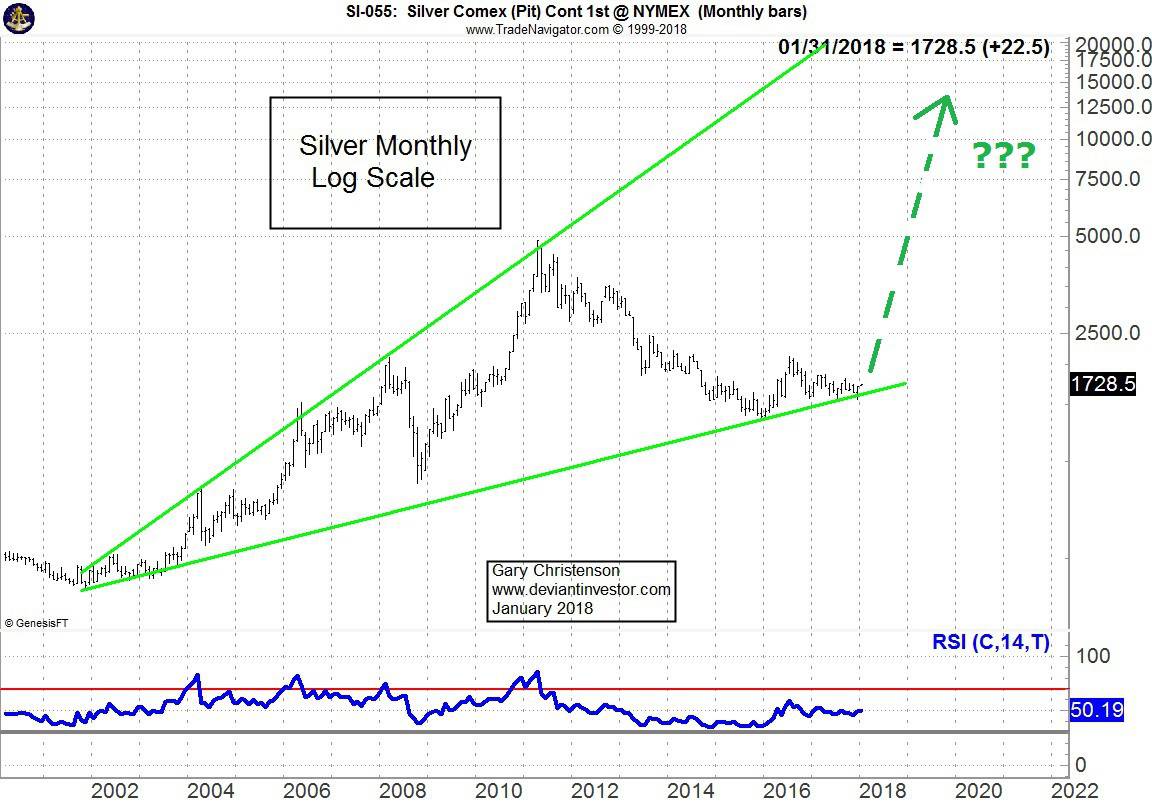
In the “Black Swan” scenario, silver prices could rise (almost) like Bitcoin prices did in 2017. Consider the following chart showing an aggressive potential for silver prices.

The five price peaks from 2002 through 2011 are connected. Another “moonshot” would push silver prices higher by a factor of ten toward $200 next decade.
Silver prices rising to $200 is no crazier than Amazon stock moving from $35 to $1,500 in seven years. Prices would exceed $300 if silver matched (only) the 2017 move in Bitcoin. Prices probably will not reach $200 soon, but much higher silver prices are coming.
REVIEW:
- Governments and central banks “print” currencies more rapidly than the underlying economy expands. Hence prices for most items, including silver, rise. Compare 1971 prices to those of 2018.
- Nothing has changed since 1971 to reverse these policies.
- The froth and speculation in the last six years has gone into the stock market, the 35 year bull market in bonds, and Bitcoin.
- Silver has been forgotten since it peaked in 2011. Silver prices were higher in 2008 than they are today. Expect silver prices to rise, probably too far and too fast, like stocks and cryptocurrencies did in 2017.
- The charts show that $50 – $100 silver is likely in a few years. Challenging economic conditions – any Black Swan – would make $100 to $200 silver probable.
Which do you think will rise more in 2018?
- A depressed and ignored silver market.
- A frothy and over-valued stock market.
- Cryptocurrencies that have already made their “moonshot.”
- Bonds, which (Bill Gross agrees!) appear to have rolled over from their 35 year bull market.
A silver advocate,
Read more: What is the Gold Silver Ratio? and When to Buy Gold or Silver: The Ultimate Guide
Plus: Wages from Ancient Greece and NZ Housing Both Say Silver Undervalued by a Factor of 20


Hey Gary, I like your bullish silver sentiment however your chart RSI looks to me like we are still in for a couple more years downside.
Hi Kevin, Yes who knows technical analysis is as much art form as science! But on Gary’s monthly chart it does look like the RSI has bottomed out over 2013-2015-ish and has moved a bit higher since then. Silver is so off the radar that it makes sense to us that it will move higher from here before too long. Plus with the Gold/silver ratio being so high above 80, history also says silver has pretty decent sized moves following this. Then again the ratio has been even high once before, so all we can do is make a best guess.
Pingback: Bullish Indicator: Large Silver Speculators First Net Short Position in Memory - Gold Survival Guide