Sorry we can’t stop publishing posts outlining why silver is likely such a good buy currently. In recent weeks we’ve had, Silver: Black Swans, 2018 and Beyond and Why Silver May Not Be “Off the Radar” For Much Longer.
We have another post this week from technical analyst Clive Maund.
He takes a close look at the very unusual set up in the silver futures market. That is, where the large silver speculators have their first net short position in memory. Meaning they are betting the price of silver will go lower.
Silver is not that much above its lows, and the gold to silver ratio is close to 25 year highs above 80. But these speculators have amassed a position where they believe silver is going even lower.
Maund explains how these large silver speculators have “a time honored tradition of being a very reliable contrary indicator”. Plus you’ll also see how currently their positions are even more extreme than normal…
Read more: Gold and Silver Commitment of Traders (COT) Report: A Beginners Guide
SILVER SPECIAL COMMEMORATIVE UPDATE – in honor of THE LARGE SPECS FIRST NET SHORT POSITION IN SILVER IN MEMORY…
By Clive Maund – Originally posted at CliveMaund.com
The purpose of this update is to commemorate the Large Specs having their first net short position in silver since the site started 15 years ago, and also to consider how we can turn this to our advantage. Before we look at silver’s latest extraordinary COT chart and consider its implications, we will first quickly review the silver charts.
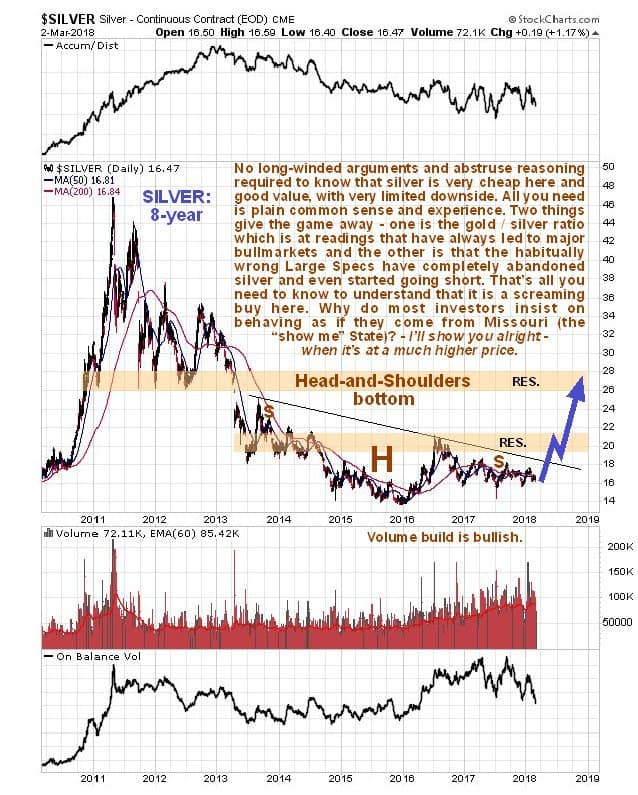
We will start with an 8-year chart that shows the big picture and includes the entire bear market from the April – May 2011 peak. On this chart we see that silver is in the very late stage of a giant downsloping Head-and-Shoulders bottom and currently grinding sideways marking out a protracted Right Shoulder low. Because of its downslope, many observers think that silver’s bearmarket is ongoing and fail to spot that this is a giant base pattern, but the parallel Head-and-Shoulders bottom in gold is much more obvious because it is flat-topped, and it is this that helps give the game away. Also because of the downslope, silver is viewed by many as being less attractive than gold, but it is normal for silver to underperform gold towards the end of a sector bearmarket and into the early stages of a bullmarket. This results in silver and silver related investments becoming grossly undervalued and neglected, and creates the conditions for a powerful rally that appears seemingly “out of the blue”. One bullish factor that seems to have escaped the notice of many observers is that volume has been building steadily for many months, which is sign of increasing distress selling by frustrated longtime holders of silver, but since the price is no longer dropping it is clear that Smart Money is mopping up their offerings at an increasing rate too. While breakout from the base pattern will be signaled by a break clear above its downsloping “neckline” silver probably won’t really get moving until it breaks above the 1st band of resistance shown.
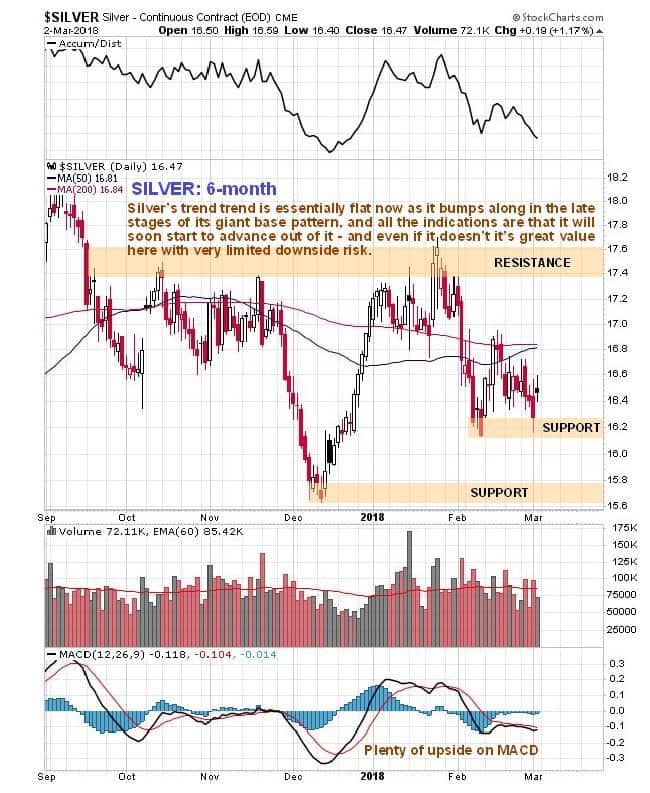
The shorter-term 6-month chart shows us recent action in much more detail. Whilst this chart is of limited use technically, it does show us that the price and moving averages are now very closely bunched together, a frequent precondition for a big rally, although this same moving average bunching occurred back in October, but that led to a break lower instead, however, at that time the COTs were not bullish at all as they are now. At this point silver is less than $3 above its bearmarket lows in late 2015 just below $14, so it is currently very cheap and good value.
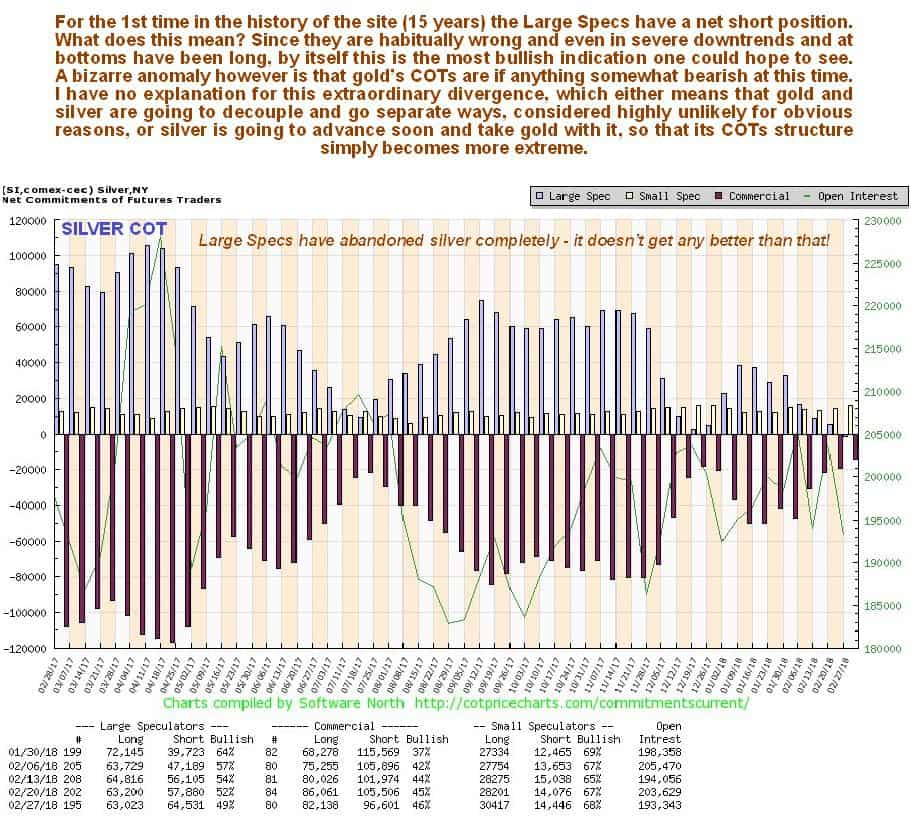
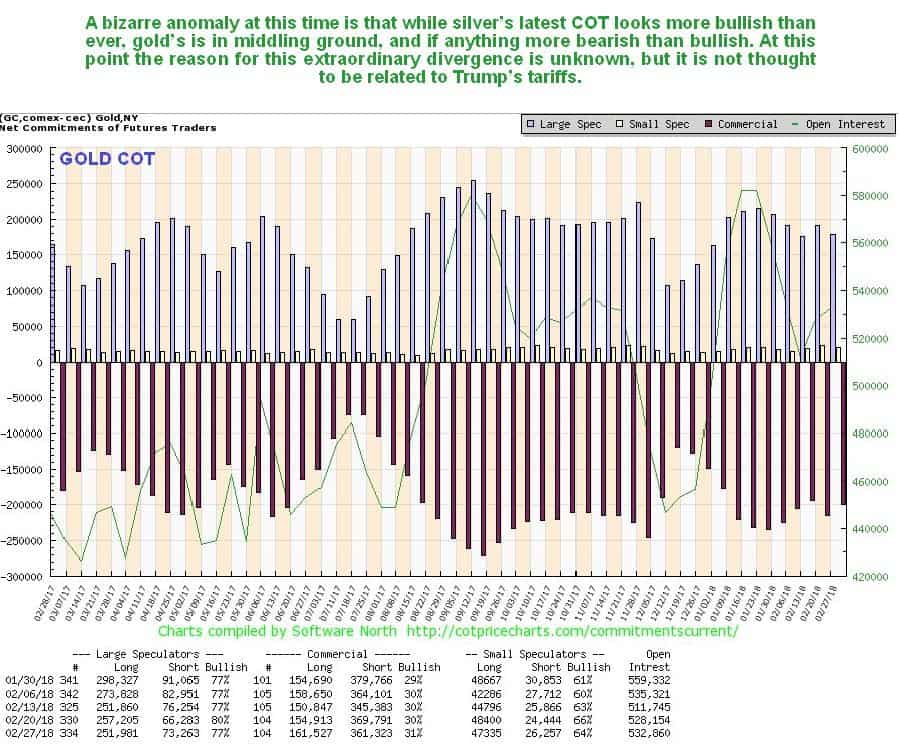
Now we come to the main focus of this article, which is to highlight silver’s latest COT, that is viewed as being extraordinarily bullish. You gotta love the Large Specs – they have a time honored tradition of being a very reliable contrary indicator, and with silver they have been and are making a special effort to uphold this tradition, and on this occasion they are “going the extra mile” by relinquishing their long positions completely so that true contrarians like us can zoom in and scoop up silver and silver related investments at rock bottom prices. The protracted year-long Right Shoulder low of the H&S bottom has ground them into the dust and they have finally given up and thrown in the towel. The setup could not be more bullish, especially considering the current silver / gold ratio.
Click on chart to popup a larger clearer version.
One somewhat troubling anomaly that we have had to contend with is that gold’s COT is nowhere near as bullish as silver’s, in fact it is not bullish at all and if anything is verging on bearish. This rather bizarre situation that has not been seen before, at least not to this extent, suggests one of two possible outcomes – either gold and silver are going to decouple and go their separate ways, which is viewed as almost impossible that they are both extracted from the same ore, or silver is going to advance and take gold along for the ride, so that gold’s COT structure simply becomes more extreme. The key point to key in mind regarding this is that the combination of a very positive silver / gold ratio and an exceptionally bullish silver COT means that silver is not going down, or if it does drop it will be by a trivial amount, while the upside potential is now very big.
Click on chart to popup a larger clearer version.
The latest silver Hedgers chart, while not at record bullish extremes yet, is not far off them…
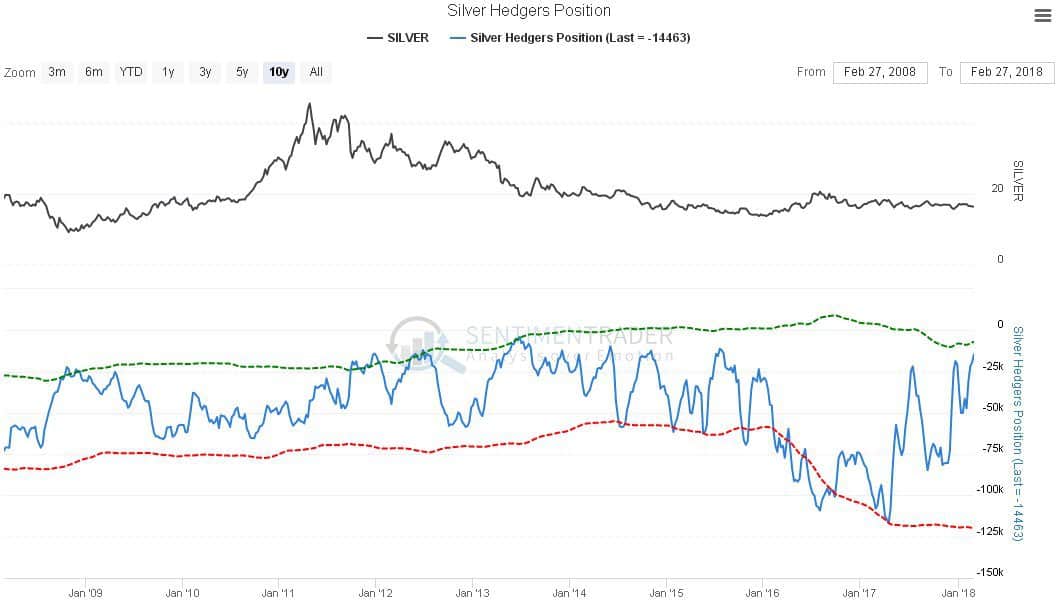
Click on chart to popup a larger clearer version.
Chart courtesy of sentimentrader.com
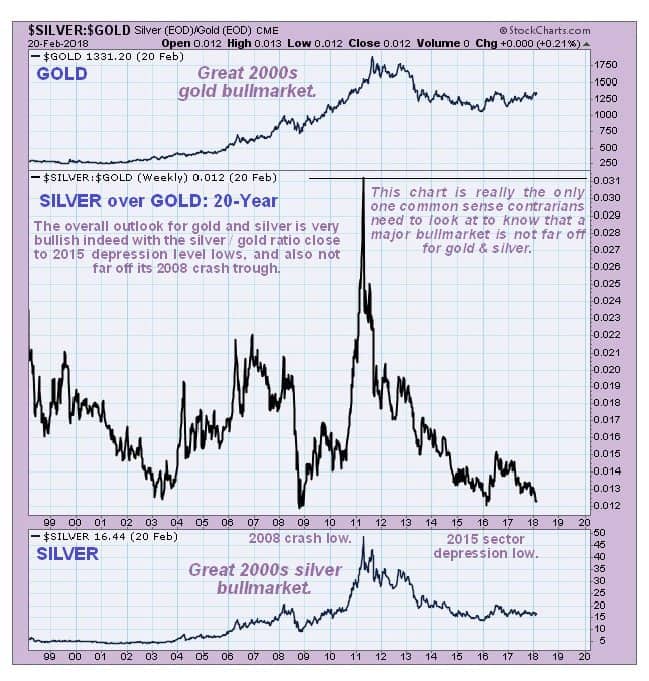
Finally, we take a look at the silver / gold ratio which shows that on the last 3 occasions that the ratio got this low over the past 20 years, it marked a bottom and presaged a major uptrend in both gold and silver. The 1st time, in 2003, led to the major bullmarket of the 2000s, the 2nd time, in 2008, marked the panic low of the 2008 global market crash, and led to major uptrends into parabolic blowoff tops in gold and silver in 2011, the 3rd time, late in 2015, marked the final bearmarket lows in gold and silver, which were followed by the rise out of the low of the Head of their respective Head-and-Shoulders bottoms. The full potential implied by this last very low reading of the silver / gold ratio late in 2015 is a long way off being realized, and the great news for would be investors in the sector is that the dip by the ratio in the recent past to approach its late 2015 lows has been accompanied by a corresponding drop in the price of silver and silver investments, making them extremely cheap again, but this is believed to be the last time we will see these low prices on offer, especially as the dollar has broken down from a major top area and is now entering what could easily turn out to be a severe downtrend.
Clearly, from all of the above, we are at a great juncture to buy the silver sector aggressively now – silver ETFs, silver ETFs and silver stocks. We have looked at a selection of silver stocks in the recent past and will be adding to them, and in addition we went for a couple of leveraged silver bull ETFs about a week ago, which are now at about the same prices and still look very attractive.
End of update.
Read more: Could Silver Be Worth More Than Gold? and When to Buy Gold or Silver: The Ultimate Guide
About Clive Maund
The years following 2005 saw the boom phase of the Gold and Silver bullmarket, until they peaked in 2011. While there is ongoing debate about whether that was the final high, it is not believed to be because of the continuing global debasement of fiat. The bearmarket since 2011 is viewed as being very similar to the 2-year reaction in the mid-70’s, which was preceded by a powerful advance and was followed by a gigantic parabolic ramp. The Precious Metals should come back into their own when the various asset bubbles elsewhere burst, which looks set to happen soon now.
Pingback: SILVER INVESTMENT: The Lowest Risk, Highest Return Potential vs. Stocks & Real Estate - Gold Survival Guide