Prices and Charts
USD Gold Hits New All Time High
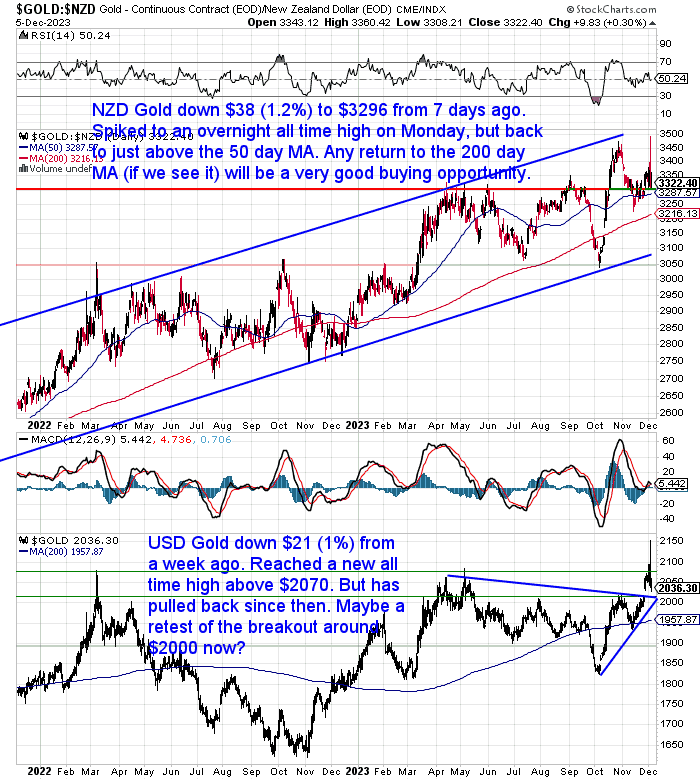
Gold in New Zealand dollars was down $38 (1.2%) from 7 days ago. It spiked up to an overnight all time high on Monday night but fell back down before NZ business hours. Today it sits at $3296, just a little above the 50 day moving average (MA). If we see a return back down to the 200 day MA, currently around $3220, that will likely be a very good buying opportunity.
In US dollars (lower half of the below chart) gold had a significant milestone, setting a new all time high above US$2070. But in the 2 days since then it has pulled back to US$2020. It looks likely that it will retest the breakout from the downtrend line around US$2000 now. There is also a “gap up” to be backfilled above $2000. The next buy zone below this (if it happens) is the 200 day MA around $1960. The odds heavily favour this being the start of a significant move higher in USD Gold. But we’ll have to wait and see what follow through we now get.
Silver Hits Downtrend Line Yet Again
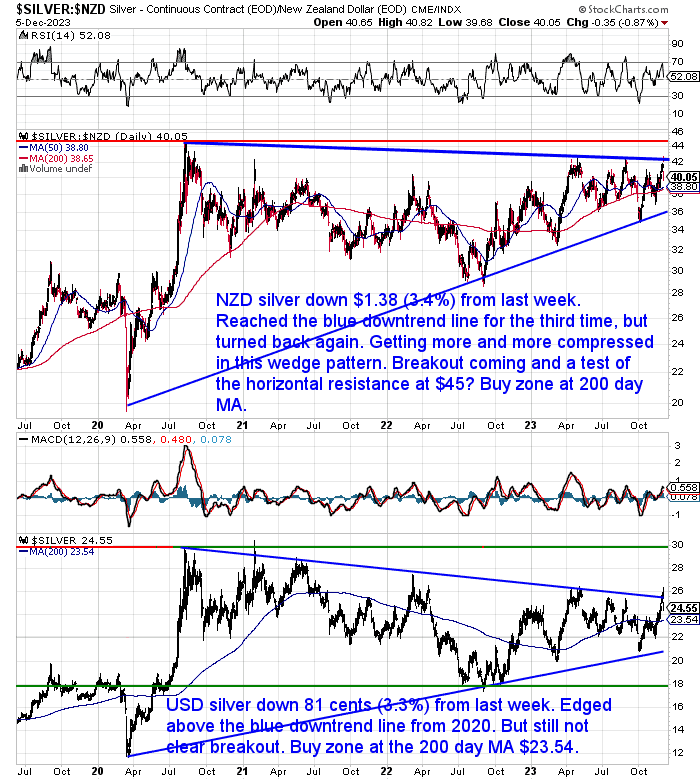
Silver in New Zealand dollars was down $1.38 or 3.4% from a week ago. It did once again hit the blue downtrend line – the third time this year. It edged through it before turning lower, so it hasn’t conclusively broken out yet. So the wedge pattern gets more and more compressed in an ever narrowing range. There is a buy zone where the 50 and 200 day MAs converge just below $38. Any dip as low as the blue uptrend line should be strongly bought. It is just a matter of time before a breakout. Odds favour this being up. Once $43 is beaten then the horizontal resistance line at $45 is likely to be tested.
In US dollars silver was down 81 cents (3.3%) from 7 days prior. It edged above the blue downtrend line but there is still not a clear breakout. USD Silver also has a buy zone at the 200 day MA ($23.54).
We get the feeling some big moves are in the pipeline for silver.
NZ Dollar Dipping Down from Overbought
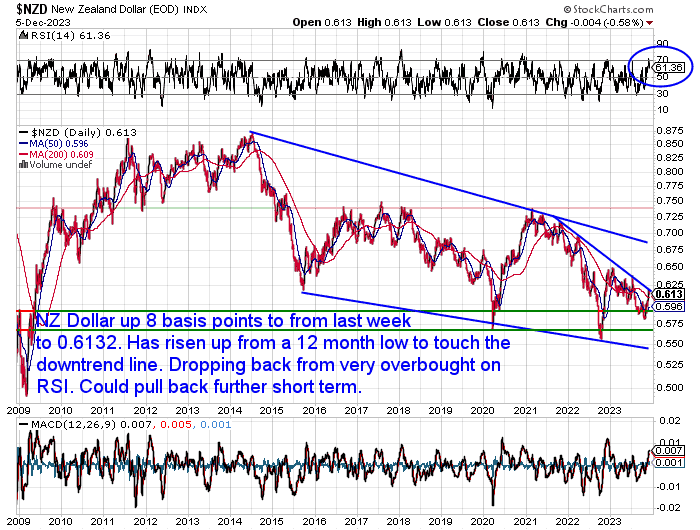
The NZ dollar was up just 8 basis points from last week at 0.6132. It has risen sharply up from a 12 month low and touched the overhead downtrend line. The RSI overbought/oversold indicator has now dipped down out of very overbought. But we could still have a further dip lower in the short term. But the Kiwi could be close to breaking higher above the downtrend line.
Need Help Understanding the Charts?
Check out this post if any of the terms we use when discussing the gold, silver and NZ Dollar charts are unknown to you:
Continues below
—– OFFER FROM OUR SISTER COMPANY: Emergency Food NZ —–
Long Life Emergency Food – Back in Stock
These easy to carry and store buckets mean you won’t have to worry about the shelves being bare…
Free Shipping NZ Wide*
Get Peace of Mind For Your Family NOW….
—–
Q & A Recording – How to Improve Your Timing When Purchasing Gold and Silver
In case you missed it here is a link to the recording from last week’s Q &A Call. The theme was “How to Improve Your Timing When Purchasing Gold and Silver”.
We covered a few basic technical indicators that will help you when buying or when selling. The knowledge we shared will also help you better understand our commentary here in our charts each week. Or in our daily price alert email if you subscribe to that.
When to Buy Gold or Silver: The Ultimate Guide (Dec 2023 Update)
The Q&A call mostly covered technical or charting analysis to help with timing your purchases.
However this week’s feature article also covers a number of other points to consider when determining when to buy.
There are many factors that can affect the price and value of precious metals, such as the economy, the currency, the supply and demand, and the market sentiment. In this article, you will learn about some of the fundamental and technical reasons for buying gold or silver, and how to use them to guide your decision. Read on to discover how to buy gold or silver at the right time and at the right price.

Your Questions Wanted
Remember, if you’ve got a specific question, be sure to send it in to be in the running for a 1oz silver coin.
Why Buying This Year is Better Than Waiting Until Next Year
There are a couple of points in this week’s feature article which are only relevant at this time of the year. So it’s worth drawing your attention to them.
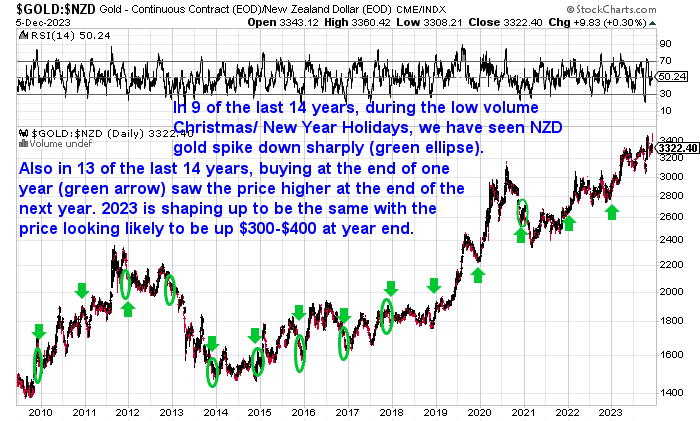
- It is getting to the time of the year when we have often seen spikes down in the price during the low volume Christmas and New Year period. This has occurred in 9 of the past 14 years. See the green ellipses in the chart below.
- History says you’ll also want to buy this year and not wait for next year. As in 13 of the last 14 years buying towards the end of one year saw the gold price higher at the end of the following year (see the green arrows).
Some of our suppliers shut down completely over the Christmas/New Year period. However others don’t, so you are still able to purchase, albeit with a more limited range of products over the holidays. So if you see a dip in price get in touch for a quote.
Central Bank Gold Holdings Rising – But Still Likely to Triple From Here
A Financial Times article this week, Gold: the consequences of war are shock and Au, highlighted that:
“Globally, central banks hold some 14 per cent of their assets in gold. US dollars accounted for 58 per cent at the end of 2022, according to the IMF. Even a small rebalancing could have big repercussions on the relatively tiny gold market.”
Jan Nieuwenhuijs says his own numbers show more like 17%. This is because he doesn’t just use the IMF estimates but makes various calculations particularly in regards to China’s gold. As they are not very transparent.
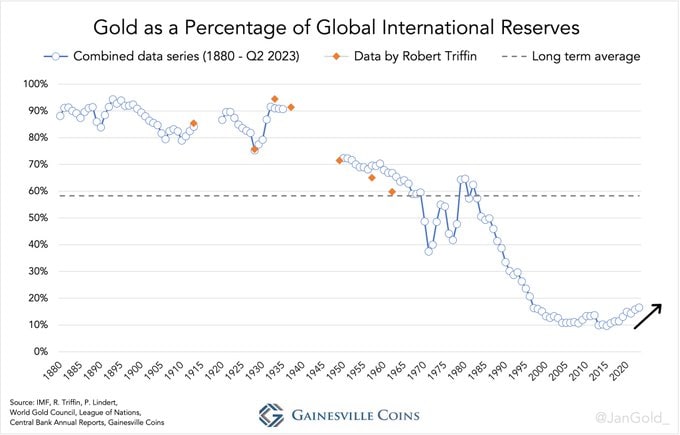
Whether the central banks hold 14% or 17% of their assets in gold, it is still a long way from previous levels. The chart above shows that at the end of the 1970’s precious metals bull market, global central bank international reserves were above 60%. This is also similar to their long term average of 58% (dotted line in the chart).
So central banks would have to add between 3 and 4 times more gold to their reserves just to match either of these levels.
Also of note is that under previous gold standards central banks held between 60% and 95% of their reserves in gold (hence why the long term average is 58%).
Silver Looking Ready to Jump (Much) Higher
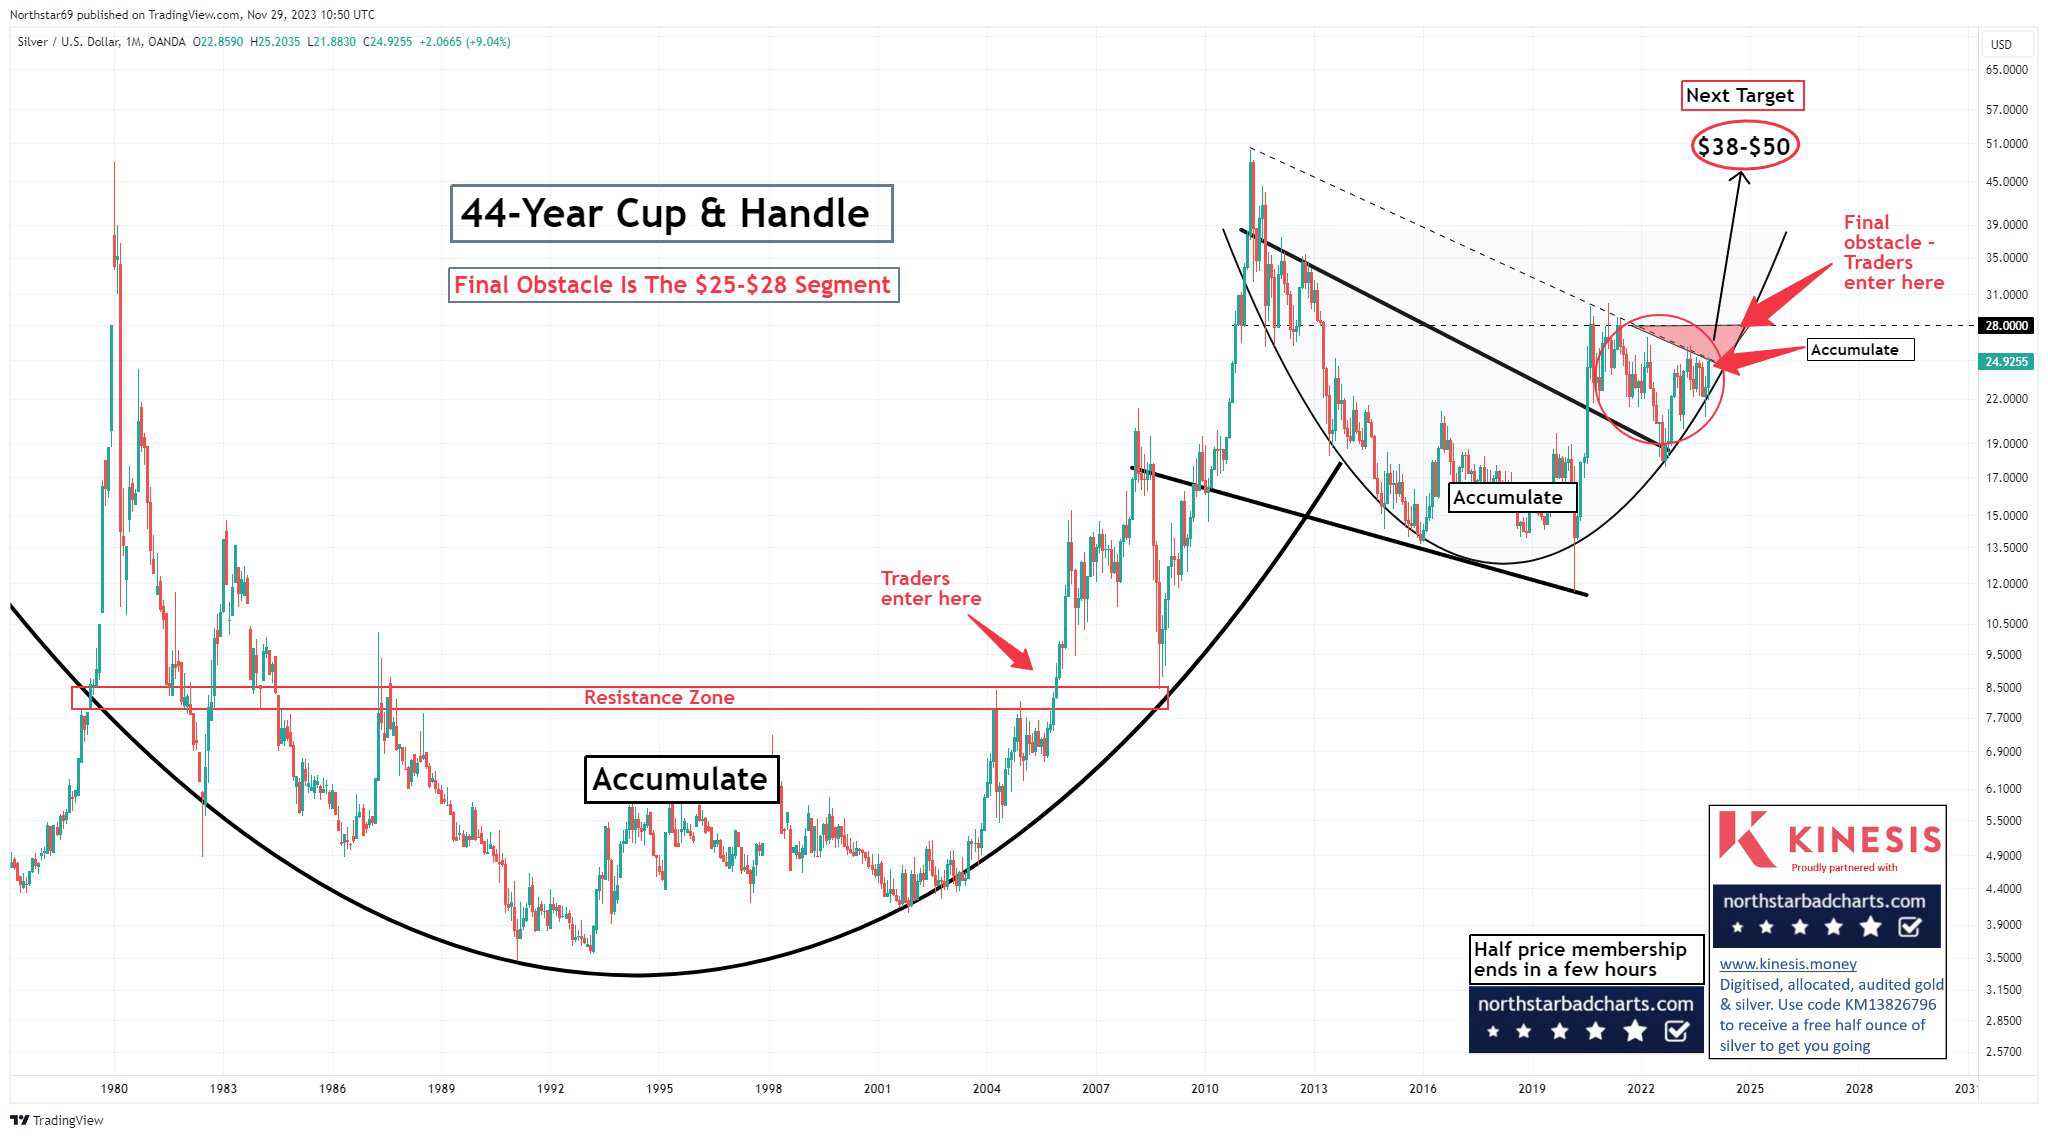
As shown earlier in our silver chart, USD silver came very close to breaking out of the wedge or pennant pattern over the weekend. Once it does that, then the next mark to beat is at the overhead horizontal resistance line at US$28.
The below chart shows a 44 year “cup and handle” pattern. Once this key $28 level is beaten then the last part of the handle will be in play with the next target being $38 to $50. It’s looking like this $28 level might not be too far off being reached.
Source.
If you’re yet to buy watch closely for any further pullbacks. But don’t get caught on the sidelines. We get the impression that there might not be much time until some larger jumps higher. Then current prices may not be seen again. Good idea to at least grab an initial position.
Please get in contact for a quote for gold or silver or if you have any questions:
- Email: orders@goldsurvivalguide.co.nz
- Phone: 0800 888 GOLD ( 0800 888 465 ) (or +64 9 2813898)
- or Shop Online with indicative pricing
— Prepared for the unexpected? —
Never worry about safe drinking water for you or your family again…
The Berkey Gravity Water Filter has been tried and tested in the harshest conditions. Time and again proven to be effective in providing safe drinking water all over the globe.
This filter will provide you and your family with over 22,700 litres of safe drinking water. It’s simple, lightweight, easy to use, and very cost effective.
Shop the Range…
—–
|