What is the value of all the silver in the world versus other assets? Chris Duane demonstrates this using a fantastic infographic. You’ll learn about Exter’s Inverted liquidity pyramid and why he believes silver should be at the very bottom of this pyramid.To begin with here is a quick summary of Exter’s Inverted Liquidity Pyramid from demonocracy.info.
All Money and Assets in the World shown in Physical $100 Bills
Here we are: The Final: All the money and all the assets in the world, shown in physical cash form, in one graphic.
The Liquidity Pyramid was created for visualizing the organization of asset classes in terms of risk and size. The Liquidity Pyramid was created during the time in United States, when each dollar was backed by Gold. Gold forms the small base of most reliable value, and asset classes on progressively higher levels are more risky. The larger size of asset classes at higher levels is representative of the higher total worldwide notional value of those assets. While Exter’s original pyramid placed Third World debt at the top, today derivatives hold this dubious honor. As financial risk increases, money tends to move from the more risky assets (Derivatives), to the least risky assets (to physical cash and then gold). Nothing is without risk, but risk is relative. The issue is that there is very little physical cash and even less Gold compared to the more risky assets, this makes for a crowded trade in times of high risk when everyone wants to jump into cash and gold, pushing up the price.

The Liquidity Pyramid | Exter’s Inverted Pyramid
The little yellow rectangle on the left front is all the gold in the world in physical form. All the gold in the world is NOT all in “financial investment grade” form. World Trade Center, Empire State & bunch of too-big-to-fail Bank HQ buildings are in the background to help illustrate the size. You are eye-level to the WTC top floors. The $1 Quadrillion Derivatives cash wall fades into the distance, because $1 Quadrillion is an estimation by the best analysts and truth is no one really knows the true size of the Derivatives Market.” Source: demonocracy.info
Here’s just some of what is covered in the video:
• Every year there has to be more debt put into the market to keep the global multi-generational debt based ponzi scheme going. • An explanation of Exter’s Inverted Liquidity Pyramid • Why Chris Duane added silver onto the very bottom of the pyramid. • Why it’s silver versus the world and why he has invested 100% in physical silver for over a decade now. • How when things get tight the most risky will be the most illiquid. • Why now it’s a sovereign global debt problem. • Why wealth is not created or destroyed but rather gets transferred from one asset to another. • Why he believes the consumer based economy of today will cease to exist. • Why real friends, real skills and real wealth are the most important things in life. • How even super “safe” government bonds will not be a safe haven in the next financial crisis. • How the next crisis will be a crash first like in 2008 but how the response will be magnitudes worse than the previous time. So cash will be massively devalued next time around. • How people will want gas, food, water, gold and silver. Real things. • How the plan is to buy up all the real assets with the money being printed and then use that to kick start the next multigenerational Ponzi scheme that the central planners will sell to the masses. • Why he only owns 1 ounce of gold and is “all in” on silver. • How the above ground supply of silver ha been shrinking while gold has been rising. 6 to 1 above ground supply of gold versus silver. While the below ground in the earths crust is more like 9 to 1 in favour of silver. • How silver is the most liquid but most undervalued. Here’s an example of how little silver is owned today: Only 31,000 people in the world could own 1 ton or half a million dollars worth of silver today. But there are 2000 billionaires in the world. 1 of them could buy it all. 16 million millionaires in the USA alone. So if only 31,000 decided to put half their wealth into physical silver there would be no physical silver in the market.
Our Thoughts on the Video to Consider
We agree that silver is incredibly undervalued versus both gold and every other asset. However we personally wouldn’t go as far as being all in on silver. Chris doesn’t take into account the stocks to flow ratio of gold being the highest when discussing the above and below ground ratios of gold to silver. What is the stocks to flow ratio?
“Unlike consumable commodities, gold and silver exhibit a large discrepancy between annual production and the total available supply which is a high stock-to-flow ratio. It is our premise that the high stock-to-flow ratio represents the most important characteristic of gold (and silver). The entire amount of gold ever mined totals approximately 172,000 tons. That is the stock. Annual production was about 2,700 tons as of 2012. That is the flow. If one divides the two amounts, one arrives at the stock-to-flow ratio of currently 64 years. Gold isn’t as valuable because it is so rare, but quite the opposite: Gold is valued so highly because annual production relative to the existing stock is so small. Putting it differently: not only scarcity, but primarily the relative constancy of the available stock is what makes gold unique.” Source.
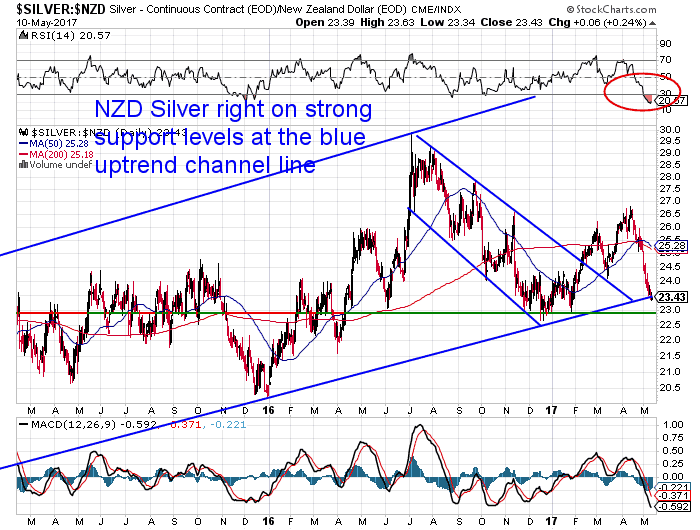
But at around 71 gold has a much much higher stocks to flow ratio than even silver. This is what makes gold the number one form of money over such a long period of time. For a complete explanation of stocks to flow ratio see: “Stock to Flow Ratio – A Primer” by Philip Barton of the Gold Standard Institute. Here’s the video: https://www.youtube.com/watch?v=5JT0Kq01CFg “Via TruthNeverTold” While we may not agree with everything Chris recommends he still makes some excellent points about how undervalued silver is. And right now is likely an excellent time to be buying silver as it sits right around long term support trend line. (See the chart below).
So please go here if you’d like a quote.We have a bonus deal going this week only – a free dictionary safe with any purchase of 500 Canadian Silver Maple Coins.

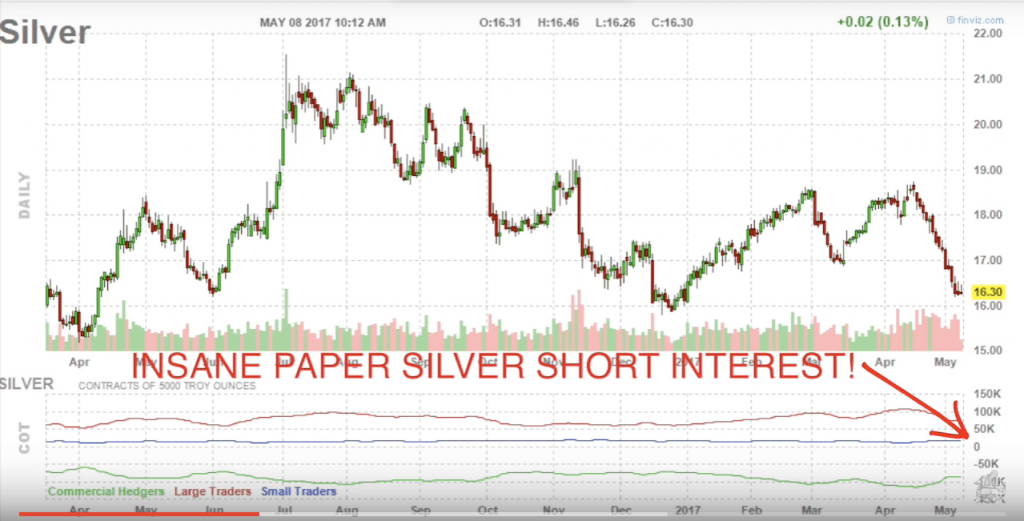
UPDATE: Since we wrote this Chris has released another video looking at whether the worst of the fall may be over for silver. He believes “on a yearly basis this is a really good time to be buying back into silver”. This is because the insanely record high commercial hedgers short position in the futures market from the end of April has finally reduced substantially. This means the commercial hedgers have covered (i.e. sold a good many of their short silver contracts. See the green line at the bottom of the chart below and how it has moved higher – indicating the short position has gone down. Read more:Gold and Silver Commitment of Traders (COT) Report: A Beginners Guide
As he says it doesn’t mean it’s over but it does make for a very good long term entry point into silver. As he believes if the price were to fall further we would likely see increasing premiums for physical silver. Here is the new video too. The first 11 minutes covers what we have summarised above. https://www.youtube.com/watch?v=YxvTfeuikDA “Via TruthNeverTold” Read more:Should I Buy Gold or Silver? 7 Factors to Consider in Gold vs Silver
Pingback: When Will You Know It's Time to Sell Gold?