
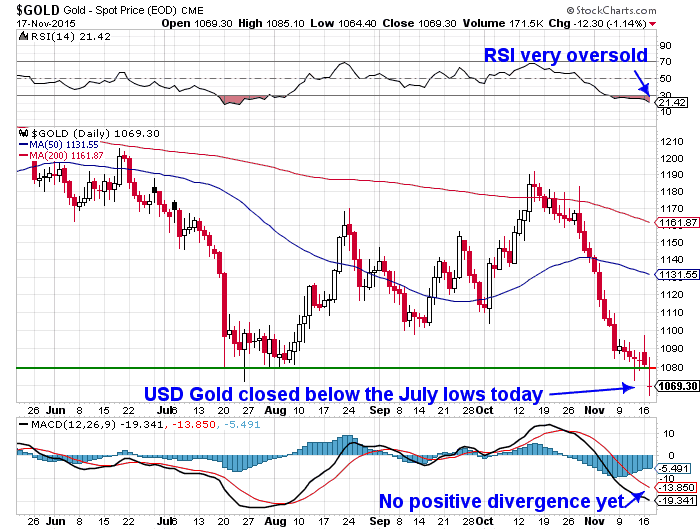
Overnight Tuesday, gold in US dollars closed below the July low of $1080. It dipped to a low of $1065.60 by late morning New York time before closing higher on $1069.30 for a daily decline of around $15 per ounce. You can see in the chart below this is a clear break below the July lows.
So Will it Go Lower From Here – to Where?
Now that USD gold has broken below previous lows, the expectation is it will go lower from here. How much lower?
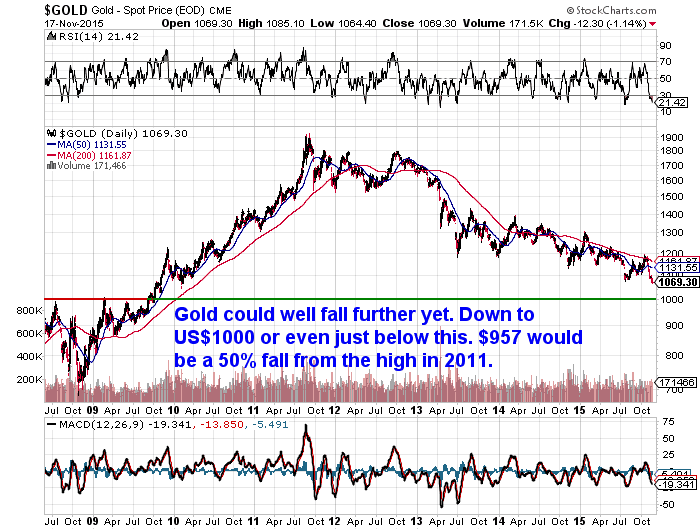
Well, as the chart below shows a 50% fall from the 2011 high would take it down to around US$957. This 50% fall would match the mid 1970’s fall half way through the 70’s precious metals bull market. So there is some history to back up that number. But bear in mind, that is not actually that far in percentage terms from where we are at right now.
Technical Indicators
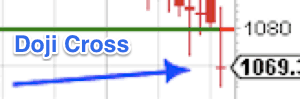
The “doji cross” in the top chart is an indicator of indecision. A doji cross occurs when the opening price almost exactly matches the closing price. This means supply and demand (buyers and sellers) are balancing each other out and indicates indecision in the market. So that is not much help to us as far as working out where to from here.
As already noted the expectation seems almost universal that now the previous lows have been broken, we will see a further significant fall from here. But we wonder, could this be one of the times where the market tricks us by not doing what everyone expects and instead bottoms out and moves up from here?
The RSI (Relative Strength Indicator) in the top chart is certainly very oversold so backs this up. But the MACD (Moving Average Convergence Divergence) doesn’t yet. As despite also being very oversold it has yet to turn back up higher (no positive divergence). So this could indicate lower prices to come yet for gold in US Dollars.
But all of this is somewhat irrelevant to NZ buyers anyway.
What about in NZ Dollar Terms?
As we always say, the key thing for NZ buyers of gold and silver is not what the commonly quoted USD gold price is doing. Rather it is what are the prices doing in NZ Dollar terms?
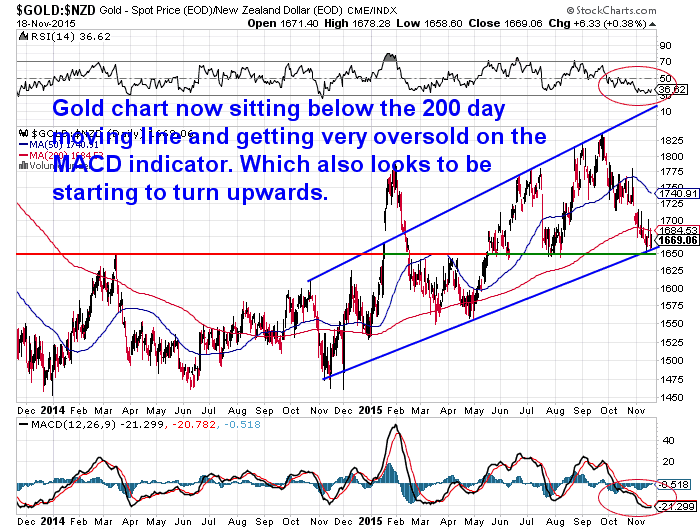
As you can see in the chart below NZD gold remains in the uptrend it has been in for over a year now. It is hovering around the lower trend line.
Also of note is that it is holding just above the horizontal support/resistance line at NZ$ 1650.
Technical Indicators
The RSI indicator (circled at the top of the chart) is as oversold as it has been since this time last year.
The MACD indicator (circled at the bottom of the chart) is the most oversold since 2013. It is also starting to turn upwards which is usually a good indicator of a change in trend.
The price is also below the 200 day moving average (red wiggly line). Since the trend in NZD gold has changed to up over the past year, anytime this occurred it has not stayed below it for long.
Of course these technical indicators are just that indicators. As we’ve said many times before in these days of cheap money and manipulation that only counts for so much. However they do lend weight to the idea that this level could well prove a good buying zone.
Read more: Gold and Silver Technical Analysis: The Ultimate Beginners Guide
Anecdotal Indicators
It’s been interesting to note that we have seen greatly reduced buying in gold and silver over the past month or so that prices have been falling. The same has been reported from our international contacts.
Premiums on the likes of silver maples and American eagles have also come down from what they were in August/September. Locally fabricated (NZ) silver premiums have not come down yet though.
So overall we are seeing lower prices and the same or lower premiums, yet less buying.
We have also seen more people unsubscribing from our daily price alert emails and weekly newsletter in the past weeks. Another sign of people throwing in the towel on precious metals.
To us this speaks of a more likely bottom here than that which occurred in July, when globally there was a real run on physical gold and silver and premiums spiked higher.
What About Silver in NZ Dollars?
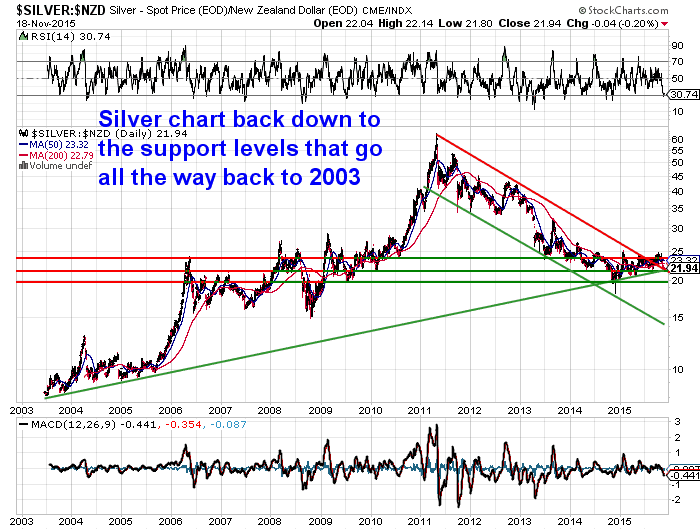
Silver in NZ dollars is also holding at some quite key support levels. In the 12 year chart below a few things stand out to us:
1. Earlier this year NZD silver broke out of the multi year downtrend it had been in since the highs of 2011.
2. NZD Silver has been in an uptrend for the past year.
3. You can see that it is touching on the 12 year support line going back to 2003.
So overall these point to this current zone being a pretty good buying zone if you are looking at holding silver as a long term financial insurance.
In Summary
With new lows in US Dollar gold, the odds favour even lower prices from here in US Dollar terms anyway. Sentiment is almost as bad as it has been in 10 years though, so perhaps we’ll at least see a bounce from here, rather than an immediate further plunge as we have seen with previous new lows.
The counter argument we make is that the expectation is almost universal that lower prices will now be ahead, so perhaps we’ll all now get a surprise?
But if US dollar gold does head lower from here, the odds favour the US Dollar will gain. Therefore the NZ Dollar will also weaken further. So priced in NZ dollars we may not see too much more downside ahead for gold.
At current prices we are right on the uptrend line of the previous year. We are also just above the support resistance line at $1650. Overall this looks like a pretty good buying zone.
Silver in NZ dollars is also sitting right on long terms support levels and like gold remains in an uptrend.
So be sure you don’t just pay attention to the news about gold. Because it will almost all be talking about gold in US dollar terms and be very bearish. And this is largely irrelevant if you’re buying here in NZ with NZ dollars. Instead take a look at the charts above. See that we remain in a pretty steady uptrend in gold and silver in NZ dollars over the past year.
Consider what is going on in the world and now might seem like a pretty good time to have some financial insurance. And with the price down it means financial insurance is cheap.
To better understand what technical analysis is, and help with timing when to buy gold or silver and check out this article: Gold and Silver Technical Analysis: The Ultimate Beginners Guide