This Week:
- How China Will Blow Up Australia (and NZ?)
- Ronni Stoeferle’s Latest Gold Chartbook
- Lloyd’s of London: Biggest Risk to Auckland and Wellington is a Market Crash
- Why we Should Talk About the Price of the Dollar
Prices and Charts
| Spot Price Today / oz | Weekly Change ($) | Weekly Change (%) | |
|---|---|---|---|
| NZD Gold | $1760.25 | – $30.12 | – 1.68% |
| USD Gold |
$1107.20 | – $27.00 |
– 2.36% |
| NZD Silver |
$23.29 | + $0.03 |
+ 0.54% |
| USD Silver |
$14.65 | – $0.08 |
– 0.12% |
| NZD/USD | 0.6290 | – 0.0045 | – 0.71% |
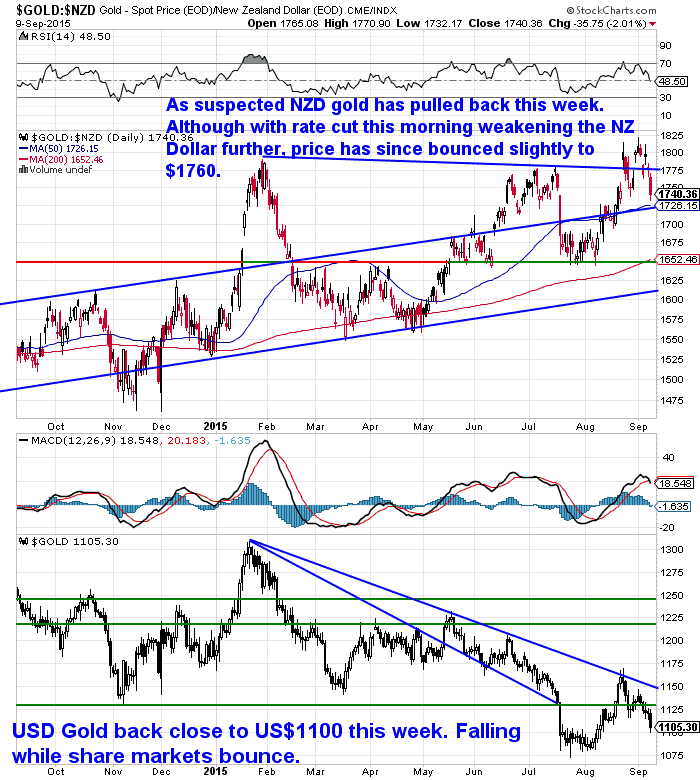
As we have been expecting gold in NZ dollars pulled back over the week, although the weakening Kiwi dollar dampened the fall to 1.68%. We are now out of overbought territory but could well fall further yet with the Kiwi dollar possibly due a bounce higher before long.
Gold in NZ Dollars remains firmly in a uptrend while in US Dollar terms it is just the opposite this year (See bottom half of chart for US Dollar gold).
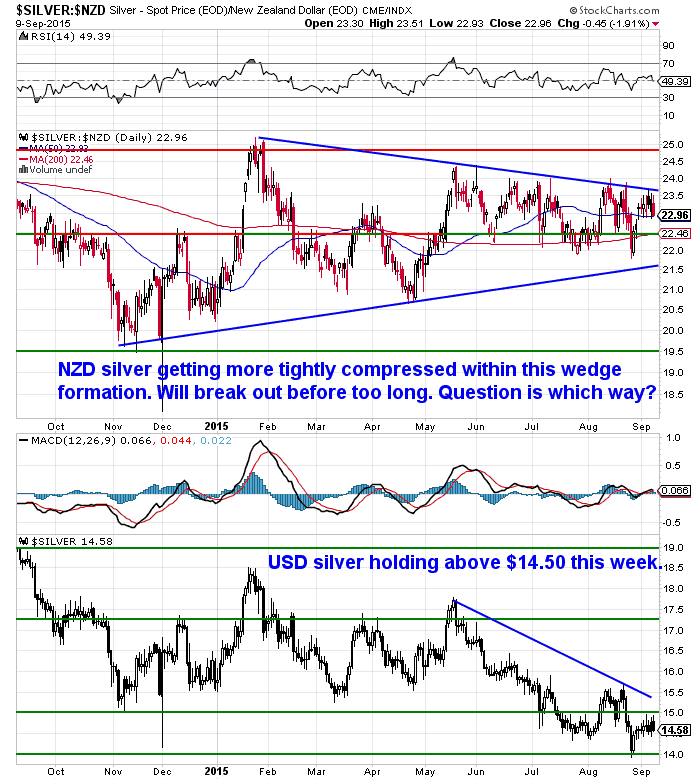
Silver in NZ Dollar terms continues to trade in a more and more compressed range as can be seen below. The wedge formation it is in will have to be broken out of soon.
As always it’s a case of which way?
Will it continue in the upwards trend from late last year? If we knew we wouldn’t be writing this email to you!
RBNZ Cuts OCR by 0.25%. 0.75% More Still to Come?
As noted already the NZ dollar fell from .6395, before this mornings 0.25% interest rate cut by the RBNZ, to .6266 as we type.
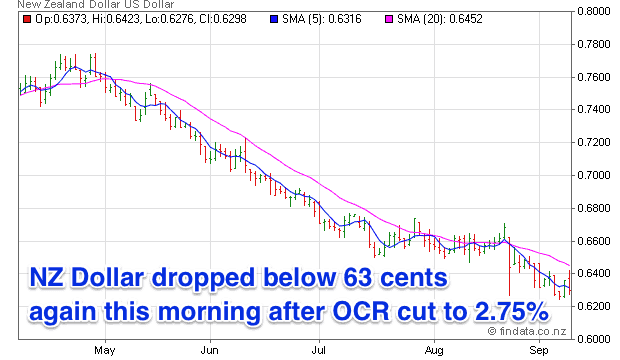
At some point this down trend will change.
However for our money it seems most traders aren’t pricing in the possibility of a recession in NZ yet. Some of the bank economists we’ve read have talked about the possibility but that is what it remains according to them, a possibility but not in their forecasts. The BNZ seems the most gloomy but even they are saying they expect annual gross domestic product (GDP) to grow 1.7%.
The RBNZ press release finished with:
Most of the bank economists are also expecting just one more 0.25% rate cut to 2.5%.
However buried in “Box D” of the accompanying RBNZ September Quarter Monetary Policy Statement was the following:
“Although financial market volatility has increased in recent weeks, at this stage a sharp deterioration in global economic conditions appears unlikely. However, if global economic conditions weaken further, there could be material implications for domestic economic activity and monetary policy.
Weaker global economic conditions would reduce demand for New Zealand’s exports, resulting in a more prolonged period of low export commodity prices and lower export volumes. Business and consumer confidence would decline further. In addition, global financial markets may become disrupted as risk aversion increases.”
Source.
The statement goes on to say this scenario would justify “further monetary policy stimulus” and so the 90-day interest rate could then decline to around 2 percent over the next year.
Our pick is that this scenario is the one that plays out, rather than just being the distant possibility that the RBNZ lays out. So we’ll see interest rates fall even further than most expect.
2% here we come?
NZ Heavy Traffic Data Indicates Economy Slowing
The ANZ truckometer ‘is a measure of economic activity using real time traffic data from around the country. Traffic data is a good indicator of economic activity, as a large portion of freight in New Zealand is transported by road.
Looking at the Heavy Traffic Index first, ANZ points out it has declined during seven of the last eight months, declining in August further to a 0.3% drop in July.”
Source.
This is perhaps NZ’s version of what is referred to in the US as “The Trann1es”.
No nothing to do with cross-dressing, rather the Dow Jones Transportation index.
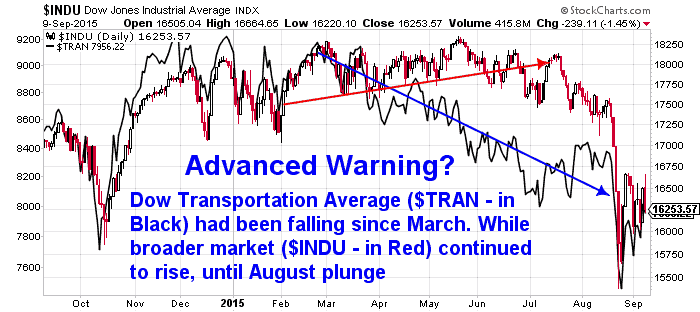
This has been steadily ticking lower all year, even while the broader US stock market continued to rise. The argument being that transportation of goods is a leading indicator of how well the economy is doing. So ‘The Transports” were forewarning of falls in the rest of the US stock market. Which recently as you’ll have heard, turned out to be accurate. See the chart below.
So keep an eye on how the ANZ truckometer goes in the next few months we’d say.
How China Will Blow Up Australia (and NZ?)
The Australian economy certainly seems to be slowing on the back of sharply reduced exports to China. Some non-mainstreamers we’ve read are picking their interest rates to head to zero like much of the rest of the developed world.
We’re part way through reading Vern Gowdie’s book “The End of Australia” which is being heavily promoted by the Daily Reckoning Australia.
Vern is not the only one with a pessimistic view on Australia.
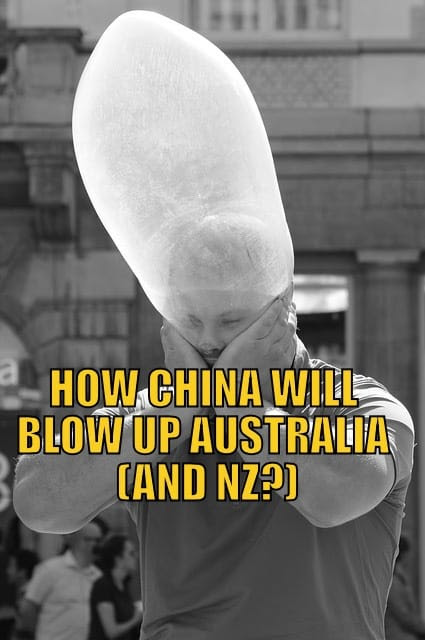 Mike Maloney put out a video “How China Will Blow Up Australia” that we posted on the site this week. He outlines why he thinks Australia will go into recession and have its property bubble popped as a result.
He also has some comments on New Zealand. So check out that video (just 7 mins). At the end of it we also take a look at some of the measures he discusses and compare the NZ numbers to that of Australia. And try to gaze ahead to what a slowing China and Australia mean for NZ.
How China Will Blow Up Australia (and NZ?)
Preparation also means having basic supplies on hand.
Are you prepared for when the shelves are bare?

For just $265 you can have 1 months long life emergency food supply.
Learn More.
—–
Ronni Stoeferle’s Latest Gold Chartbook
We received an email this week from Ronni Stoeferle with details of his latest report. He states:
Here is Scenario 1 in case you haven’t read the last In Gold We trust report:
Back to Ronni’s recent email:
“Nothing has changed since beginning of July regarding the Incrementum Inflation Signal: Deflation is the name of the game and in fact, deflationary pressure has even strengthened further! In our view the markets are in the midst of a paradigm shift: Deflationary forces are increasingly spilling over from commodity into equity markets. The low volatility period on equity markets has likely come to an end!
Some of the key takeaways our new Chartbook are:
• The FED is NOT out of bullets, it is just very reluctant to use them before we are at least close to a full fledged crisis; currency swaps, QE and negative interest rates are all on the table.
• We therefore expect increasing market turmoil before the FED reverses course!
• Shorting equities is a tricky business in an increasing volatility environment but could prove to be an interesting macro play until the FED gives in.
• Traditional protection for equities (puts) by now are somewhat expensive, especially in comparison to some short term interest rates (eurodollar). In our opinion it is quite a safe assumption, that the FED would reverse course if US equities sold off further 10-15%.
• A major deflationary event and (potentially internationally coordinated) reaction of central banks could finally be the trigger for the transition from deflation to stagflation!”
The chartbook can be downloaded below. If you haven’t read the In Gold We trust report from earlier this year, or thought it looked too long, then definitely have a skim through the Chart Book instead.
Lloyd’s of London: Biggest Risk to Auckland and Wellington is a Market Crash
Interesting NZ Herald article last week about a recent Lloyd’s Global Threat Analysis “examining the possible financial fallout from an oil price shock, floods, volcanoes, pandemics, storms and other disasters”.
Interestingly the study cites a sharemarket crash as the biggest threat by a country mile to both Aucklands and Wellingtons economies.
New Zealand, these are things you should be worried about
“That is predominantly the effects on the share market from extreme movements in share prices and we’re talking about the value of the interruption to economic activity as a result of a market crash over five years,” Galloway said.
The index estimated $11.84 billion of New Zealand GDP was at risk from many man-made and natural threats during the next decade.”
You can also click through to Lloyd’s interactive site to profile threat levels by Location, City, and Threat type.
Here are the top 5 threats and links to the Lloyd’s data for Auckland & Wellington:
Top 5 Auckland Threats
- Market Crash
- Flood
- Oil Price Shock
- Volcano
- Human Pandemic
Read More About Auckland Threats
Top 5 Wellington Threats
- Market Crash
- Earthquake
- Flood
- Oil Price Shock
- Human Pandemic
Read More About Wellington Threats
For most of these risks you need to have your household prepared with Food, Water, Emergency Lighting etc. Check out our sister site Emergency Food NZ for any of that. We’ve added a few new products in recent weeks.
In terms of a stock market crash, the two assets with no counterparty risk Gold and Silver will likely hold you in good stead for that occurrence.
Get in contact if you’d like a quote for either.
We were a bit busier today, perhaps the interest rate cut this morning got people thinking about what lies ahead?
Free delivery anywhere in New Zealand and Australia
We’ve still got free delivery on boxes of 500 x 1oz Canadian Silver Maples delivered to your door via UPS, fully insured.
Todays price is $14,980 and delivery is now about 7-10 business days.
— Prepared for Power Cuts? —
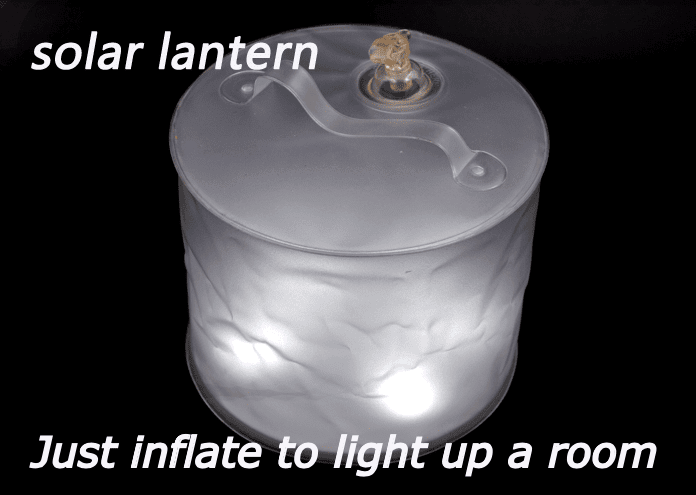
[New] Inflatable Solar Air Lantern
Check out this cool new survival gadget.
It’s easy to use. Just charge it in the sun. Inflate it. And light up a room.
6-12 hours of backup light from a single charge! No batteries, no wires, no hassle. And at only 1 inch tall when deflated, it stores easily in your car or survival kit.
Plus, it’s waterproof so you can use it in the water.
See 6 more uses for the amazing Solar Air Lantern.
This Weeks Articles:
|
||||||||||||||||||||||||
|
||||||||||||||||||||||||
|
||||||||||||||||||||||||
|







Pingback: Biggest Threats to Auckland and Wellington - According to Lloyd's of London
Pingback: How the China Slowdown Will Impact NZ - Gold Survival Guide
Pingback: NZD Silver has broken out of a 4 year downtrend - Gold Survival Guide