Table of Contents
Estimated reading time: 7 minutes
A recent question from a reader asked about the relationship between Copper and Gold:
While not advocating storing copper bars under the bed, as a lifelong engineer I have always been an avid scrap collector and the red metal in all its forms has always been a steady earner. I’ve never kept records as such but anecdotally my opinion is that copper should be, at least, about half as much again to be at an average.
The copper price has been rising quite well recently and being referred to Dr Copper given that it is the first metal to move when economic activity picks up, there is currently a body of thought that the manufacturing cycle is picking up post covid. I wondered if you had an opinion on the relationship of what this will have to the more traditional bullion.
All this talk recently of the bullion to house ratio caused me to think, is there a relationship between copper and gold/silver price movements, if so is it relevant?
The Different Factors Driving Copper Compared to Gold
Yes there does seem to be somewhat of a relationship between copper and gold.
There are different factors driving gold and copper. The very interesting website Long Term Trends, explains:
“Gold is the most widely recognized safe-haven asset among investors. Therefore, during times of economic and geopolitical distress it generally tends to perform well, making it a leading indicator of fear.
Copper is the exact opposite. Because it is a key industrial metal that is used globally in a wide range of industrial applications, it performs strongly when the global economy is firing on all cylinders. This makes it a leading indicator of global economic health and has led to it being commonly called Dr Copper.
The ratio prices copper in gold and represents the number of ounces of gold it takes to buy an ounce of copper.”
The Copper to Gold Ratio Correlates with Long Term Interest Rates
However the ratio does have a strong correlation with the 10 year US treasury Bond Yield.
“Interestingly, the Copper to Gold Ratio correlates strongly with the 10-year US Treasury Bond Yield and is often mentioned as a leading indicator for interest rates.”
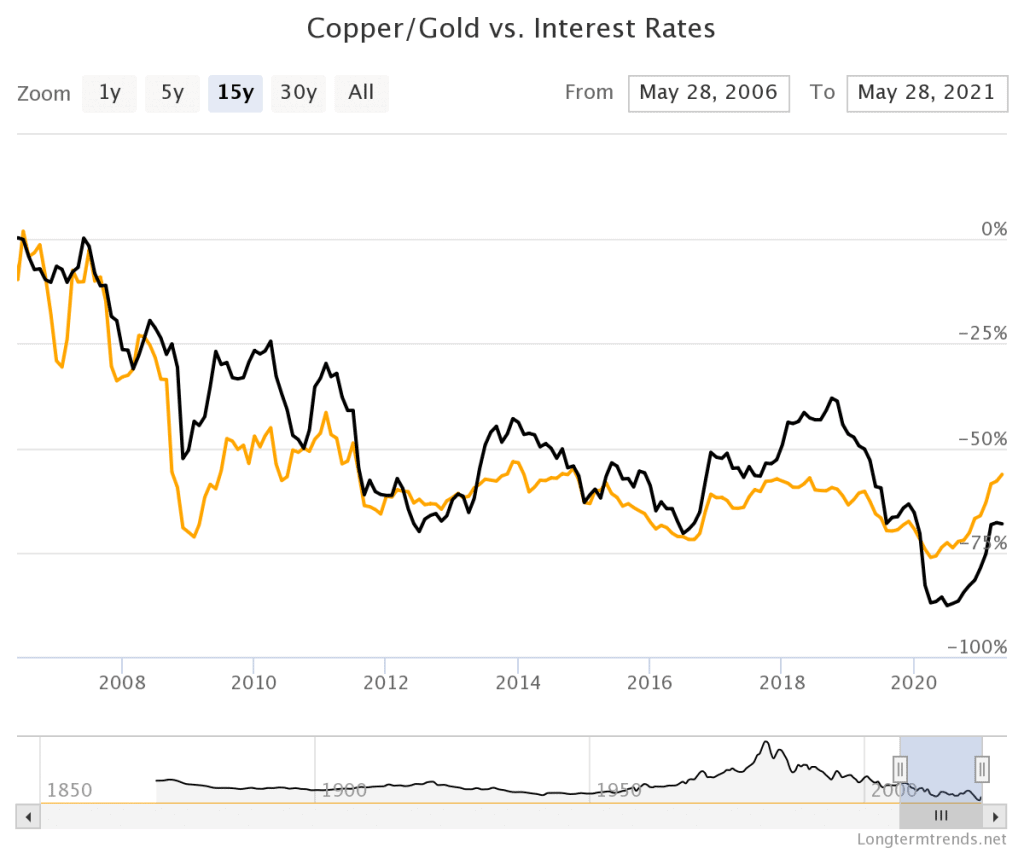
This makes sense if copper is in fact “a leading indicator of global economic health”. Interest rates get raised as an economy starts to overheat. So a rising copper price would lead interest rates higher.
Has This Correlation Broken?
However, in December a Bloomberg article argued that the Gold to Copper Ratio and Interest rate link had “broken”:
“The relationship between the copper-gold ratio and Treasury yields, one Jeffrey Gundlach’s favored indicators, looks broken.
The ratio had an uncanny link to 10-year yield levels over the past five years. Yet in recent weeks, copper has rallied hard while gold plunged, sending the ratio to levels that suggest 10-year yields should be about double — even with today’s eight basis-point jump to 0.92%.”
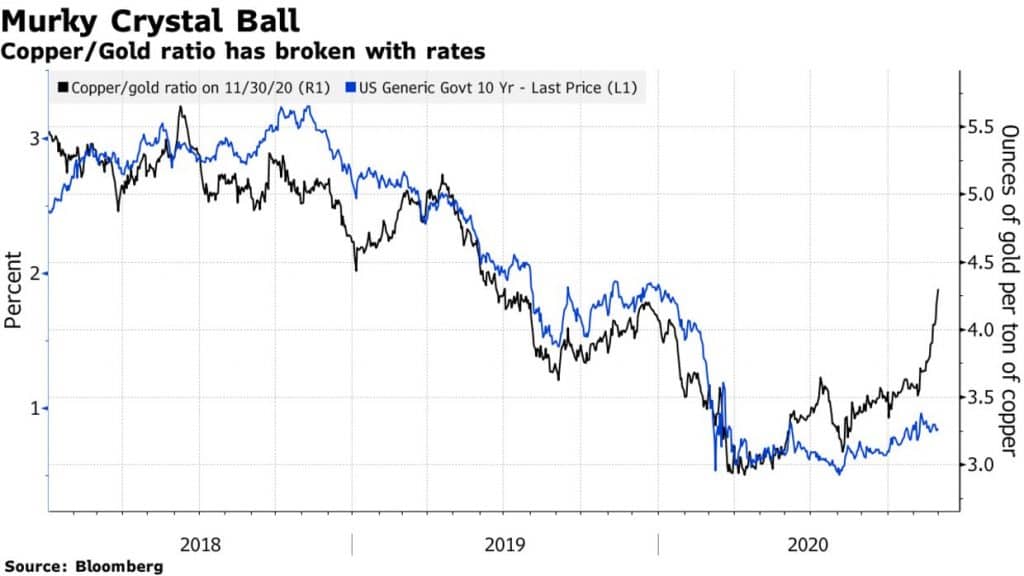
Not So Fast – The Correlation is Still Intact
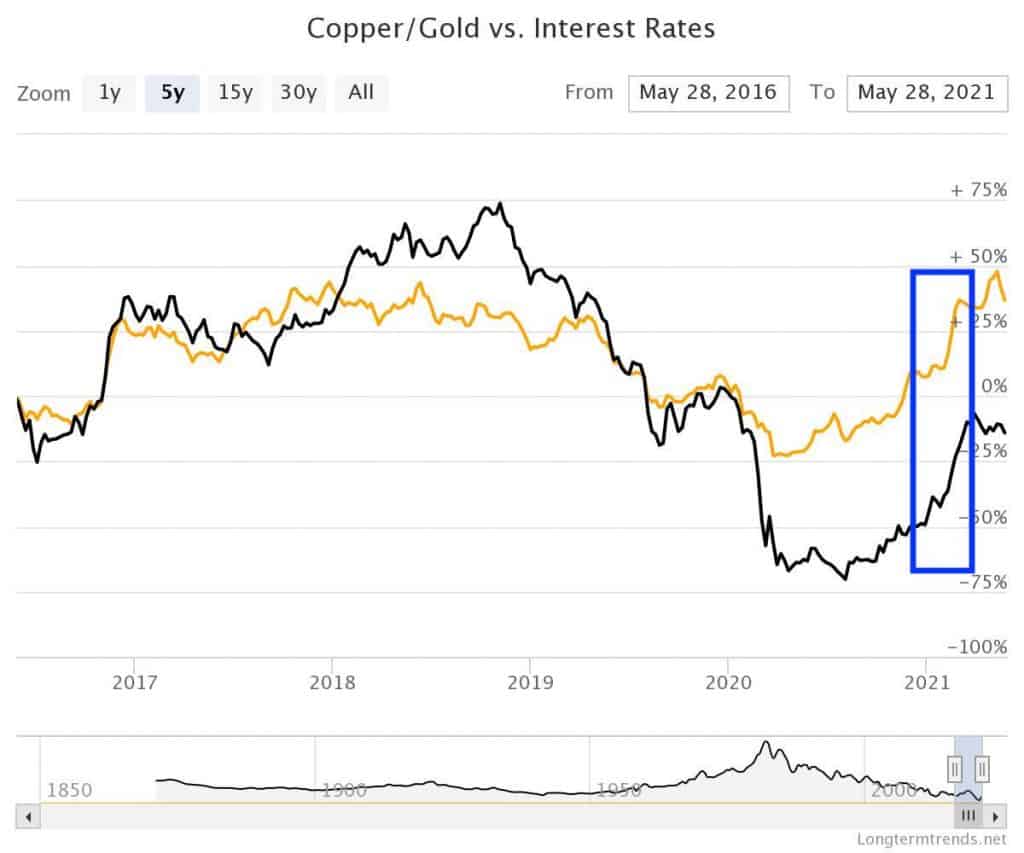
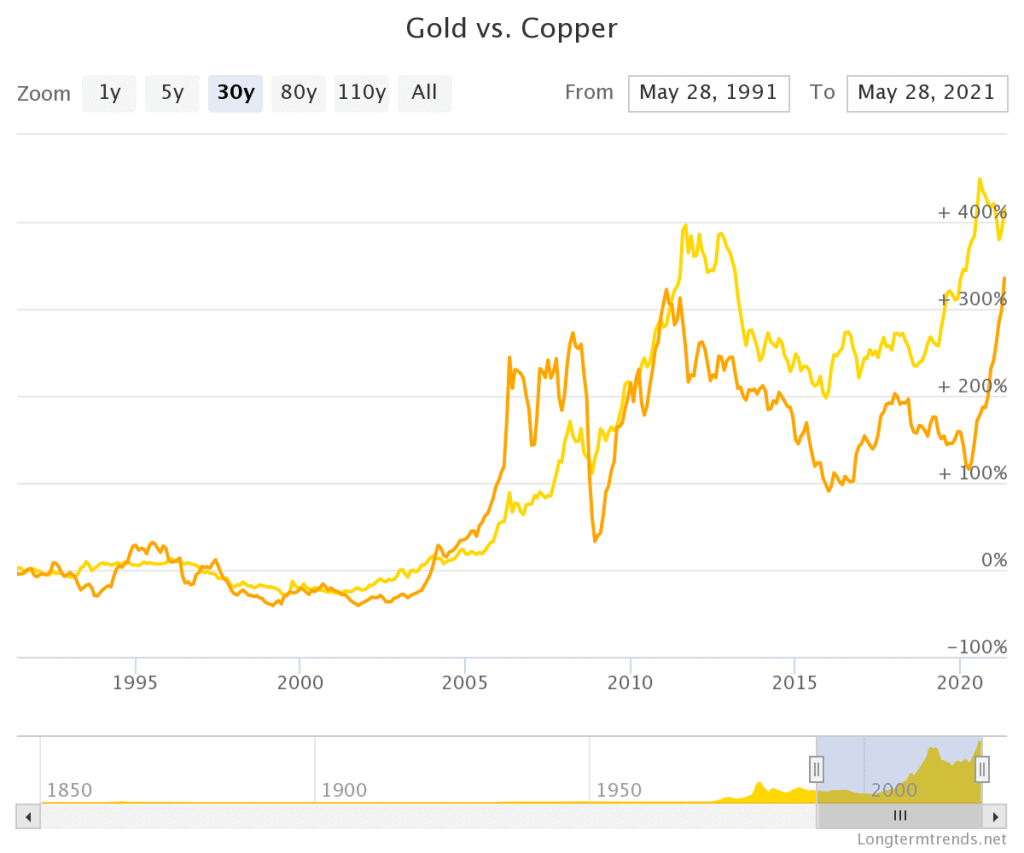
However we can see now that the writer may have been a bit premature. As just days after this article was published, treasury yields started to rise quite sharply in December 2020. See how in the chart below, to the left of the blue box, the copper/gold ratio had spiked higher, while interest rates went sideways. But then from December (see the blue box) interest rates also spiked higher.
Our Opinion on the Copper/Gold Ratio
We think it may be better to say the Copper to Gold ratio is an indicator of an expected pick up in inflation, rather than a “leading indicator of global economic health”.
We’re backed up by the latest Incrementum In Gold We Trust report. Just out today it states:
“…we consider the copper/gold ratio, which shows a tight correlation with US Treasuries, to be an exciting inflation indicator. If the trend reversal in the copper/gold ratio is sustainable, US Treasuries are likely to face increasing headwinds – headwinds that could, however, be stifled by the capping of bond yields. In other words, a noticeable pickup in inflation would be the needle that would burst the bond bubble. But the central banks – by means of yield curve control – will act as a protective shield for the bond bubble.”

Our guess is that Gold will follow Copper higher. We’d find it hard to argue with the below opinion from Richard Mills…
“During the 2008 financial crisis central banks used quantitative easing and money-printing, monetary policy, to try and re-boot the economy, resulting in an increase in M2 money supply. However this did not result in inflation. Why?
The answer is that in 2008, we did not have the spending component. All the stimulus money stayed within the banks. This time is different. Among the US government’s emergency covid-19 measures are/ were direct “stimmy” aka helicopter money payments, of $600, $1,200 and $1,400 (at separate times).
Central bankers have realized that keeping interest rates low and maintaining monthly asset purchases (ie. quantitative easing), have not given the desired economic boost; now they are counting on fiscal policy, ie., government spending, to do the trick.
The US government has so far spent $4.5 trillion on pandemic-related relief, boosting the national debt to $28 trillion in under a year. In October 2020, the debt zoomed past 100% of GDP, for the first time since WW II, but that was just the beginning. Based on monetary programs the Fed is already executing, the money supply will increase by at least another $2.3 trillion this year.
Thus, we have monetary easing happening at the same time as fiscal spending “carte blanche” (remember Biden believes strongly in the power of the state to tax and spend. A long wish list waits to be filled, with little to no concern regarding the already out of control $28 trillion national debt, courtesy of Modern Monetary Theory, or MMT)
The result of these two forces acting together, is bound to create inflation; in fact it’s already happening, and we can prove it.”
They go on to outline all the indicators showing higher inflation is already in the USA, before finishing with:
“…All indications point to another gold run amid rising geopolitical tensions, tighter supply, central bank gold buying, low interest rates, negative real yields, and what could be the most inflationary period in decades.
Although gold hasn’t yet reacted to rising inflation, we expect it eventually will.”
Source.
The above was written on 5 May.
Since then we have seen gold break out and move higher. So gold could well be starting the catch up phase compared to copper now. See how after correcting for many months there is now a noticeable uptick in gold in the chart below.
Are you prepared for the potential for coming higher inflation?
Pingback: We should not expect inflationary pressures to ease soon - Gold Survival Guide