Prices and Charts
NZD Gold Back to the Middle of Uptrend Channel
After getting back down close to the 200 day moving average (MA) gold in New Zealand dollars was up $31 (1%) this week. It now sits in about the middle of the uptrend channel it has traded within for almost 3 years. Any return to the 200 day MA will likely be a very good buying opportunity.
While in US dollars gold today sits just under the $2000 mark, rising $36 over the past 7 days. Having retested the break out from the downtrend channel, can gold now push above $2000 and make a higher high?

Silver Continues to Get More Compressed
NZD silver was up 80 cents or 2% this week. It is above both the 50 and 200 day MAs. NZD silver continues to trade within this wedge or pennant pattern. Getting more and more compressed in an ever dwindling trading range. It will have to break out of this before too much longer. See this week’s feature article below for more on why we think silver is poised for a larger move.
USD silver was up 3% from 7 days prior. Also in the same sort of wedge pattern. Just above the 200 day MA and remains in a decen tbuying zone still.

NZ Dollar Moving Towards 0.61
The New Zealand dollar was up 55 basis points to 0.6046 this week. It has bounced back sharply from a 12 month low. It could well head higher up to the 200 day MA at 0.6100 yet. But for now it remains in a long term downtrend.

Need Help Understanding the Charts?
Check out this post if any of the terms we use when discussing the gold, silver and NZ Dollar charts are unknown to you:
Continues below
—– OFFER FROM OUR SISTER COMPANY: Emergency Food NZ —–
Long Life Emergency Food – Back in Stock

These easy to carry and store buckets mean you won’t have to worry about the shelves being bare…
Free Shipping NZ Wide*
Get Peace of Mind For Your Family NOW….
—–
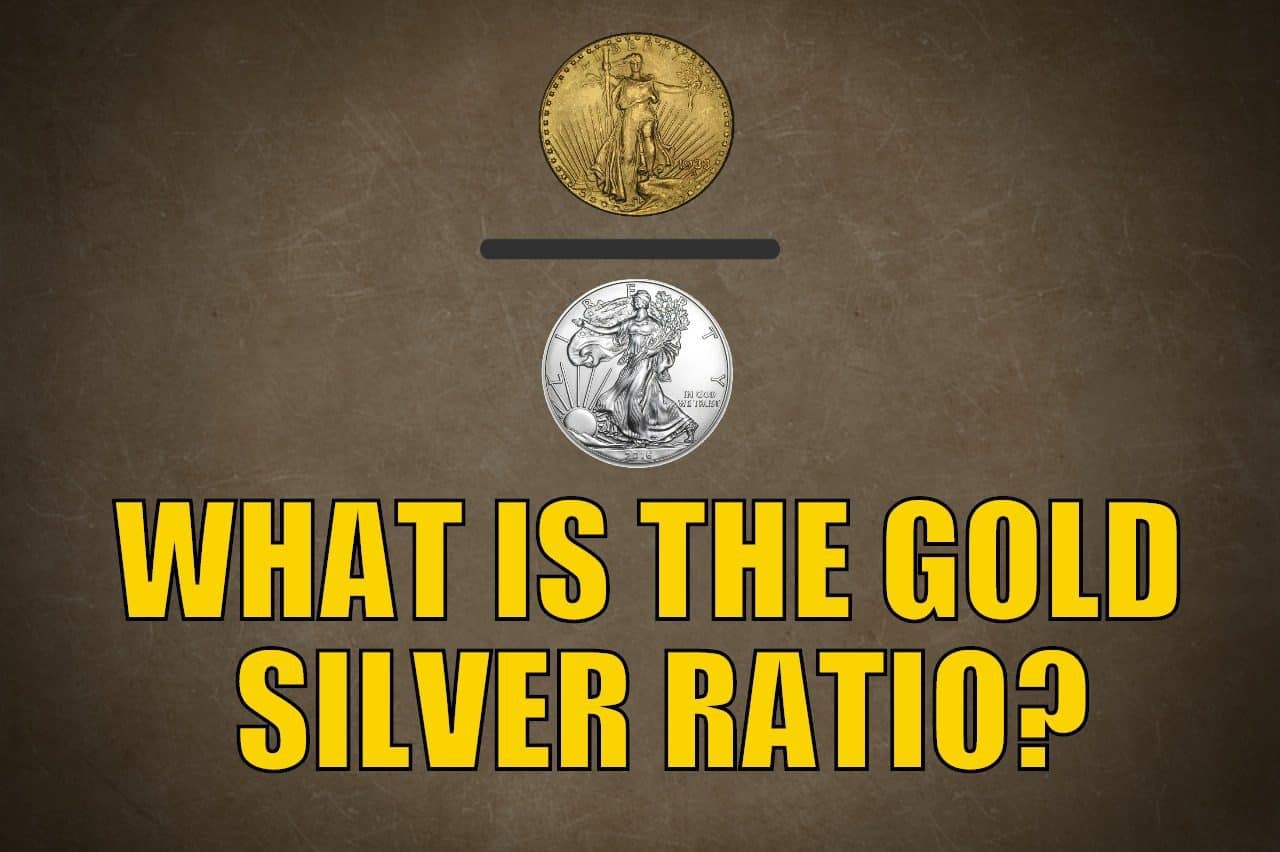
Gold Silver Ratio Close to Break Out? Higher Silver Prices in 2024?
The gold silver ratio is a useful indicator of the relative value of gold and silver. It shows how many ounces of silver it takes to buy one ounce of gold. In this week’s feature article, you will learn how to calculate the gold silver ratio, how to use it to decide when to buy or sell gold and silver, and why the ratio is still very high today. You will also discover the historical range of the ratio, the ratio of gold to silver in the earth, and how high silver could rise if the ratio falls.
The article covers the following topics:
• What is the Gold Silver Ratio? How is the Gold/Silver Ratio Used?
• So What is the Ratio Telling Us Now?
• How to Use the Gold Silver Ratio to Determine Whether to Buy Gold or Silver
• Why is the Gold/Silver Ratio Still Very High?
• What is the Ratio of Gold to Silver in the Earth?
• How High Could Silver Rise if the Gold/Silver Ratio Falls?
• What to Do? What Percentage of Silver Versus Gold Should I Own?
Your Questions Wanted
Remember, if you’ve got a specific question, be sure to send it in to be in the running for a 1oz silver coin.
What Happens If Central Banks Stop Hiking Interest Rates?
Gold has reached new all time highs in multiple currencies. NZ Dollar, Aussie Dollar, GB pound, Japanese Yen. But not yet in USD. But with the price today hovering just under US$2000 it may not be far off. With many central banks currently on pause as far as interest rates rises go, this chart from Ronnie Storferle at Incrementum is one worth paying attention to right now…
“Best chart from Ronnie’s speech. Gold smells it. Get ready.”

Source.
Massive Divergence Between Gold and Silver
Our feature post this week uses the gold price to silver price ratio to show that silver is undervalued compared to gold. Here’s a chart with the price of silver overlaid against gold since 1974. Showing a very large divergence between the 2 metals…
“Very big picture there is a massive divergence between $GOLD & $SILVER. Last time the two had a larger divergence like this, silver played catch-up big time. And this time, silver will break out of a 43-year+ cup and handle. So the over-shoot this time should be absolutely mega.”

Source.
So if gold is possibly about to break out, then silver could well be set for an even bigger move. It has a lot of catching up to do.
We also get the feeling there is not much belief in the chance of a silver break out. Reading posts on facebook or twitter there are plenty of posts that say something like “Yeah right”, or “I’ve been waiting years”.
The silver to gold ratio chart in this week’s feature article shows that the ratio has been getting squeezed into a smaller and smaller trading range, from which it will have to break out of pretty soon. Our guess is this will finally be down – meaning that silver will gain on gold.
Soft Landing Mentions = Hard Landing in Real Life?
We’ve been reading more and more about a likely “soft landing” for the US economy. Meaning that despite the current significantly higher interest rates, the US wouldn’t go into a recession. We’ve had stock market analyst Jim Cramer jump on that bandwagon now too:
“Wall St: Don’t worry. This time is different.
Cramer going bonkers saying that Powell has engineered a soft landing. Did he forget when the Fed pivots, that’s not so bullish?”

Source.
We’re seeing the bank economists here in NZ also now predicting no more interest rate rises.
ANZ’s chief economist Sharon Zollner no longer expects the Reserve Bank to increase the Official Cash Rate above its current 5.50%
Source.
However we’d also add some further commentary to the above chart. Because our guess is that any pause or reversal in interest rate increases is likely to resemble the 1970’s/early 80’s. Rather than the 2000’s. Meaning any pause or interest rate reduction will be followed by another upwards cycle of interest rate increases. And most likely multiple waves as occurred in the 70’s.
Here’s another chart on this topic from Tavi Costa which plots the number of mentions of “soft landing” in company filings and presentations since 1995. We can see the 2 previous largest spikes were soon after followed by a recession. So this is looking likely to be as good a contrarian indicator as Jim Cramer professing a soft landing!…
“A reminder: Hard landings are often preceded by the rising popularity of the soft landing narrative.”

Source.
Ray Dalio: U.S. Debt Problem Could Quickly Get Worse
Following on from last week’s item that interest costs have hit $1 Trillion for US debt. Hedge fund manager Ray Dalio says this is likely to become somewhat of a vicious circle:
“Soaring U.S. government debt is reaching a point where it will begin creating larger problems, Bridgewater Associates founder Ray Dalio said Friday.
The hedge fund titan warned during a CNBC appearance that the need to borrow more and more to cover deficits will exacerbate the political and social problems the country is facing.
…Along with the basic budget issues, Dalio also cautioned that foreign buyers, who make up about 40% of demand for U.S. Treasurys, have been backing off, creating a supply-demand problem.”
Source.
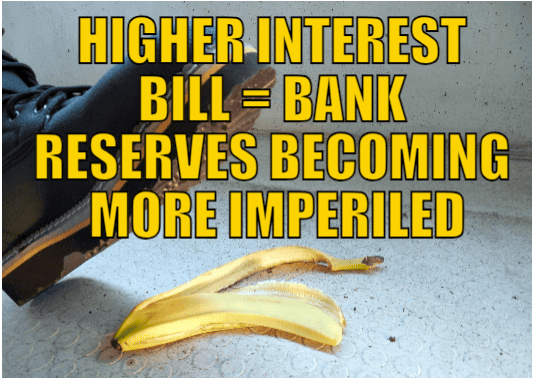
Higher Interest Bill = Bank Reserves Becoming More Imperiled
Peter Spina of GoldSeek highlights a very good point made in an article entitled:
“Debt Avalanche: INTEREST Alone on the US Debt Is Now a Trillion Dollars per Year!”
“Then, as we’ve already seen to great detriment, the Treasuries the banks have remaining are devalued by the rising interest. That means bank reserves continue to become more imperiled behind the scenes, AND YOU HARDLY HEAR ANYONE TALKING ABOUT IT ANYMORE, as if it’s gone away just because the Fed isn’t saying a word about it …”
Source.
This behind the scenes problem is evidenced by the Feds Bank Term Funding Program spiking by 3.9 billion to a new record high $112.9 billion last week.
Recall that this was the lower interest rate program introduced to stem the bank failures back in March.
But US Banks are still sitting on $650 billion of unrealized losses.
Plus that’s not the only indicator of risk to the US banking system. Here’s more worrying signs:
“The American Financial System:
1. Delinquent commercial real estate loans at US banks have hit their highest level in a decade.
2. US bank stocks have collapsed to all-time lows when measured against the S&P 500 index.
3. Jamie Dimon and his family will sell $141 million of JPMorgan stock in 2024.
4. US banks are sitting on an estimated $650 billion in unrealized losses on their bond holdings.
5. The 60+ days delinquency rate of the subprime-backed ABS that Fitch tracks rose to 6.1% in September… this represents a RECORD. ”
Source.
Meanwhile a small bank failed in the US earlier this month.
Odds are it won’t be the last. We recall the financial crisis in 2007-2009 saw a number of waves of bank failures across the planet. So buckle up and be prepared for more to come yet…
Please get in contact for a quote for gold or silver or if you have any questions:
- Email: orders@goldsurvivalguide.co.nz
- Phone: 0800 888 GOLD ( 0800 888 465 ) (or +64 9 2813898)
- or Shop Online with indicative pricing
— Prepared for the unexpected? —
Never worry about safe drinking water for you or your family again…
The Berkey Gravity Water Filter has been tried and tested in the harshest conditions. Time and again proven to be effective in providing safe drinking water all over the globe.
This filter will provide you and your family with over 22,700 litres of safe drinking water. It’s simple, lightweight, easy to use, and very cost effective.
Shop the Range…
—–
|


Pingback: More Warnings Signs For Global Banking System - Gold Survival Guide