As we noted in another article this week gold has fallen further over the past week and is now at 5 years low in US dollar terms.
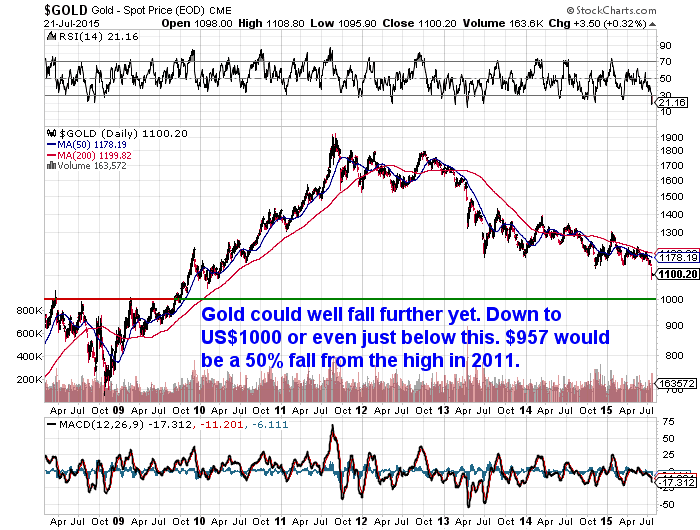
As can be seen in the chart below:
Gold Could Fall Further Yet in US Dollar Terms
We wrote right back in 2011 that gold could well fall 50% and that buyers of gold should be mentally prepared for such an eventuality:
“gold fell 50% in the middle of the 1970s bull market
It’s also worthwhile looking at the last precious metals bull market of the 70’s. From the end of 1974 to the middle of 1976 gold actually fell 50% from $200 to $100! Ouch. You don’t hear this discussed too much even by those in the gold game. But this wasn’t actually the end of the bull market in gold. Real interest rates were still very negative during this period – not getting consistently into positives until 1980. Can you imagine if gold fell 50% now?!!! That would be a price of $950US! Although for us New Zealanders it’s likely if this took place that the NZ dollar could also be significantly weaker so we may not see such a drop in local gold prices”…
(As we’ll get to shortly this has indeed been the case so far.)
“With the amount of uncertainty around at present it’s hard to envisage such a fall happening. But while a 50% fall seems unlikely, it’s not an impossibility. And we reckon if you’re a holder of gold it’s worth thinking through scenarios such as this to consider how you’d react. Those of us who held silver in 2008 had to sit through a very large drop then and so know what it might feel like. But if you’re a more recent buyer it’s worth contemplating your possible reaction.
As we explained in this article from last week, we prefer to follow indicators other than price as a measure of when a top might be reached. And as the 1970’s show a 50% fall isn’t necessarily indicative of the end of a bull market. But it pays to have patience when it comes to gold as while it can move upwards very quickly, history shows there are also periods where it may go nowhere for a while too.”
https://goldsurvivalguide.co.nz/just-how-low-could-gold-fall/
Well patience has certainly been required! When we wrote that in 2011 we didn’t necessarily expect to see a 50% fall. Nor did we expect it to take 4 years to occur!
Now that 50% fall in US dollar term is only about another $150 per ounce away. And with not a lot of technical “support” on the chart we might well see it before too long.
What About Gold in NZ Dollars?
Back in May 2013 after the plunge in gold then, we wrote that we thought the bottom was likely not in and that we could well see NZD gold fall further. We suggested the $1400 level as a possible next stop. While a 50% retracement from the highs in NZ Dollars would be NZ$1175.
https://goldsurvivalguide.co.nz/how-much-further-could-gold-in-nzd-fall/
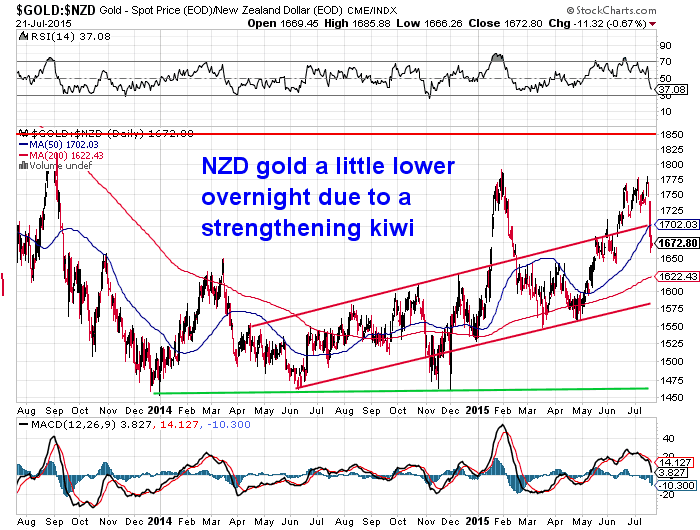
So far in NZ dollar terms we haven’t quite got to the $1400 level. With the lows last year being around NZ$1450.
As noted earlier, we’ve instead seen the weakening NZ dollar actually drive gold prices up for NZers. That is the NZ dollar has fallen faster against the US dollar than gold has. So gold in NZ dollars has been steadily trending higher all year.
However the past few days have seen the price drop around $100 an ounce. Mainly driven by the USD gold price falling but also a slight strengthening in the NZ dollar.
Where to From Here for NZD Gold?
If USD gold does indeed get down to $1000 an ounce, and if there is not much change in the NZD/USD exchange rate (which is a reasonable sized if as the NZD could well rise a bit from here), then this would put the NZD gold price down to around $1575.
This would also be around the red rising support line in the chart above.
Plus there is still another NZ$100 per ounce it could fall past this and still hold at the lows of last year around $1475.
We do think the odds favour some lower prices from here, both in USD terms and importantly for NZ holders in NZ dollar terms.
So if you’re thinking of buying we’d recommend you sign up for our daily price alerts to be kept up to date of where the NZ gold and silver prices are and our guesses of where they might be going.
As these falls could happen quickly and not last long you might not have much chance to buy at lower levels. See the link below to learn more…
https://goldsurvivalguide.co.nz/dailypricesalert/
As we wrote about last week, premiums for silver have risen locally in NZ too. So these could well increase further if global demand picks up even more on these lower prices. This was just what we saw happen back in 2008.
Capitulation in Gold and Silver Finally Here?
We might well be seeing capitulation in gold and silver right now. This is similar to the 1970’s when gold fell from $200 in 1974 to $100 in 1976. Before then rising to $850 over the following 3 years.
Silver Not Confirming Lows
Interestingly silver hasn’t followed gold lower yet. Which may well be a positive factor as Stewart Thomson thinks might be the case.
-
“At the 2011 highs for gold and silver, silver began failing to confirm the new highs for gold.
-
Now, silver is not decisively confirming the new lows for gold.
-
Against the background of strong bank buying, and the outrageous fear of lower prices shown by most amateur gold analysts, this budding non-confirmation of silver versus gold gives me confidence that both silver and gold are poised to move higher, with silver leading the way.”
We’d agree that when the turn around comes silver will likely rise much further than gold.
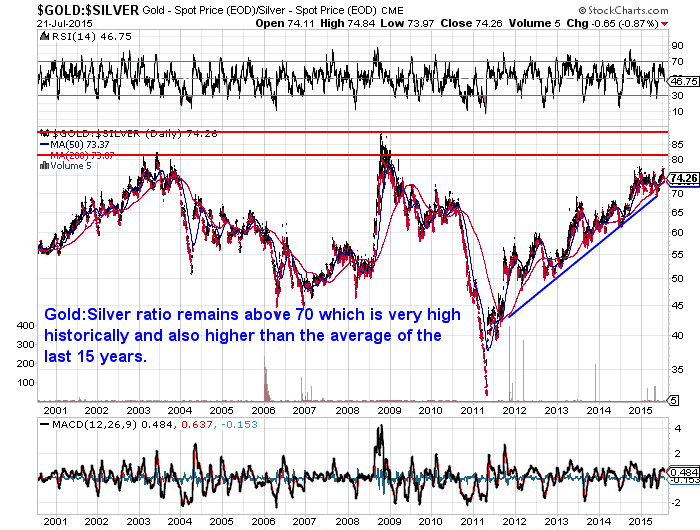
This is backed up by the Gold:Silver ratio currently standing at 74 to 1. Historically when it has previously gotten to these levels (such as in 2003 and 2008), it has returned to lower levels quite rapidly.
New Precious Metals Bull Market Likely Not Far Off
While we are seeing plenty of mainstream articles citing the death of gold in recent days, bull markets don’t end like the top in 2013. There was no “blow off” top in silver or gold and very little public participation back then. So the past few years have likely been a correction just like was experienced in the mid 70’s.
In New Zealand dollars gold looks to have been in a bull or rising market since the end of last year. We think it’s likely we are not too far from it returning to one in US dollars too.
Martin Armstrong recently summed up how these bottoms play out in markets :
‘At the top, the majority is long and they become the fuel to make any market crash and burn.
‘At the bottom, the opposite unfolds for everyone will be short. They will pile on looking for $600 gold and will count their profits upon entering the trade. They become the fuel to send the market higher for it always begins with a short-cover rally; people continually try to sell each rally, looking for that new low, just as the people at the top remain convinced that a decline would follow with new highs.’
When this happens there is no one left to sell and so surprisingly only buyers remain. The trick (and difficult thing to do) is to be one of these buyers when there is a sea of negativity.
You may get a chance in the not very distant future…
To better understand what technical analysis is, and help with timing when to buy gold or silver and check out this article: Gold and Silver Technical Analysis: The Ultimate Beginners Guide


Pingback: Silver & Gold Price: The Breakdown - Gold Prices | Gold Investing Guide