Weekly Market Wrap – 11 June 2025
This Week:
Estimated reading time: 5 minutes
Weekly Price Overview – 11 June 2025
Silver surged again this week, clearly breaking out, while gold cooled off.
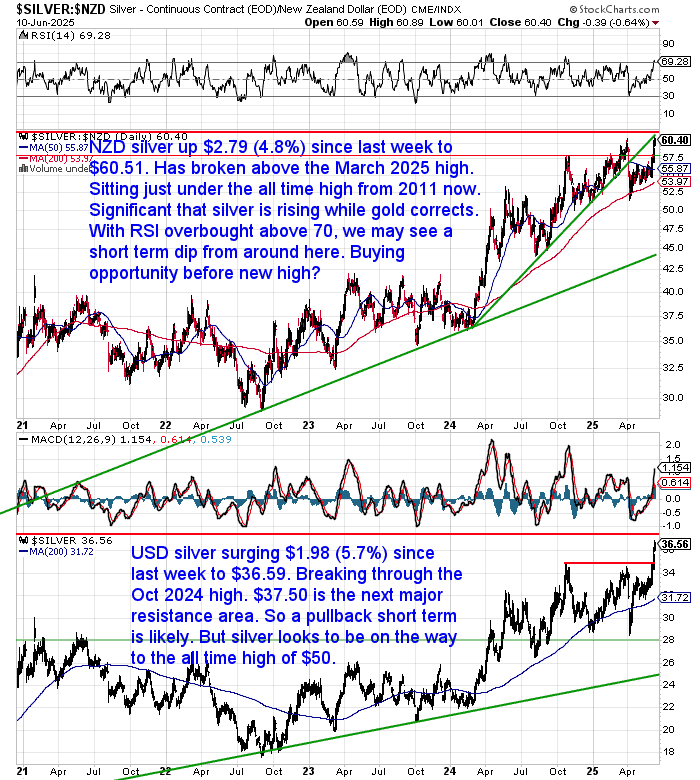
NZD silver is now just below its all-time high. USD silver is gaining momentum and looks ready to test the 2011 peak at US$50.
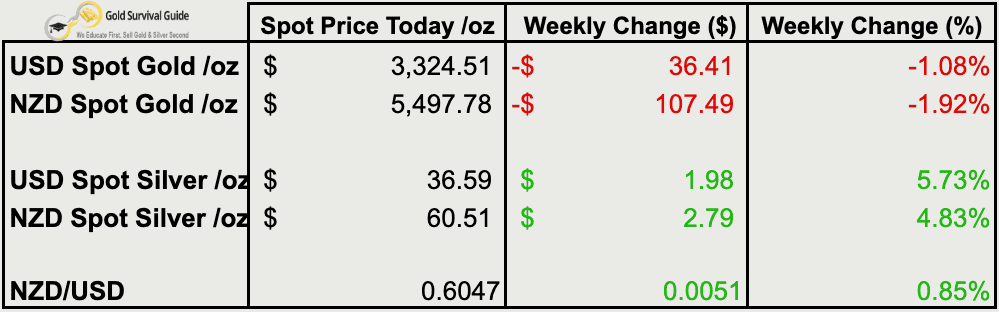
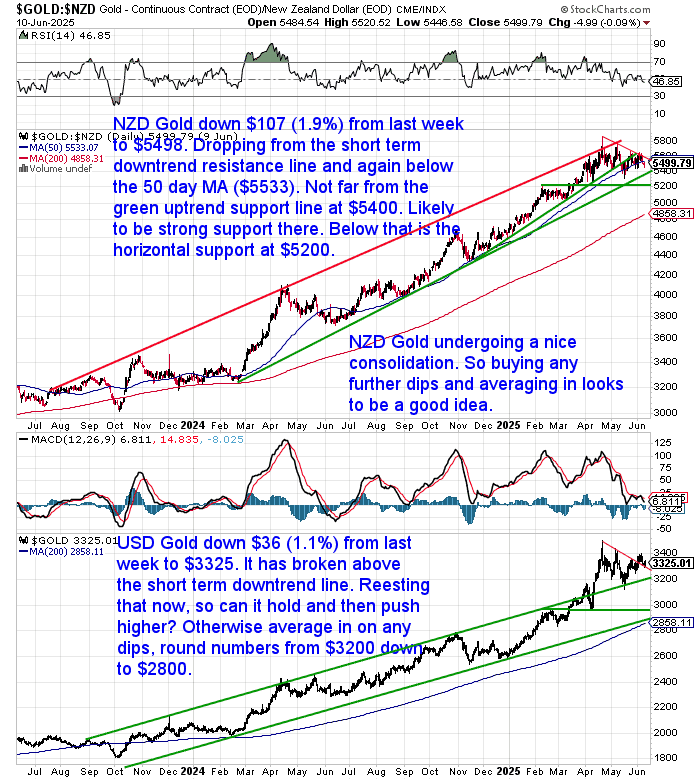
🟡 NZD gold dropped $107 to $5,497.78 (-1.92%), slipping below the 50-day moving average but still above major support. USD gold fell $36 to $3,324.51 (-1.08%), retesting its breakout zone.
⚪ Silver outperformed again. NZD silver rose $2.79 to $60.51 (+4.83%), breaking above the March high and approaching the 2011 peak. USD silver jumped $1.98 to $36.59 (+5.73%) — now above its October 2024 high, with $37.50 the next resistance. (See our feature article for long-term charts and silver price projections.)
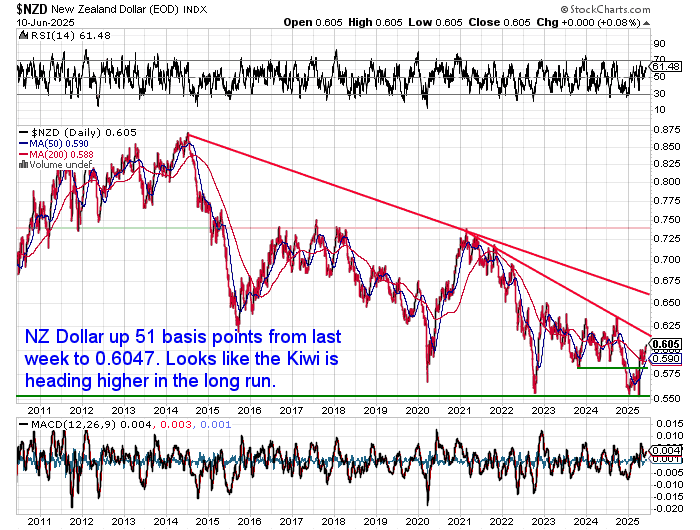
💱 The NZD gained 0.85% to 0.6047, extending its recent rally. A stronger Kiwi may cap short-term NZD metals upside, but longer-term momentum suggests more strength ahead.
📈 Technicals show gold is consolidating above trend support, while silver continues to lead. Pullbacks remain good buying opportunities — especially in silver, which is now trading on breakout watch.
Retail Sells Into Breakout — Why That Might Be Bullish
Despite the breakout in silver, premiums above spot on 500 coin mint boxes of silver coins have been falling the past few days. What does this mean? The retail public are not buying silver, but likely selling instead. As more supply means the wholesalers drop their premiums.
What can we draw from this? It’s likely a contrarian indicator: Just like with gold earlier in the year retail selling likely means the silver price will be heading higher.
Ray Dalio: Are We Near the Edge of Civil War?
With the riots in California and Trump ordering in the US National Guard to quell the unrest, billionaire investor Ray Dalio released a long post on a potential civil war.
Ray Dalio warns that the U.S. is entering Stage 5 of its historical “Internal Order–Disorder Cycle”—the critical phase just before civil conflict erupts. This stage is marked by failing systems for resolving disputes, rising polarization, and increasing violence between opposing social or political factions.
Dalio stresses that civil war doesn’t always involve shooting—what matters is when normal conflict resolution breaks down and people begin to see each other as enemies, often using legal, police, or private militias as tools. History shows that once this threshold is crossed, societies descend deeper into violent confrontation until one side clearly prevails .
He urges that America’s leadership and citizens must recognize this danger and make deliberate choices—between retreating from the brink or continuing toward breakdown—by reinforcing democratic norms and collaborative problem-solving.
His full and very detailed post is here.
Australia Also Exporting Record Amounts of Gold to USA
ASB commented again on gold this week (this might be the 4th month in a row, see here, here and here.) Although it was on the gold price dipping. No mention of silver surging – not a surprise. However it was interesting to see them reporting on the export of gold from Australia to the USA. Just like from the UK and Switzerland this year, there has been a massive surge in Aussie exports. Basically no one else could get any gold because it was all going to the USA. Again the argument is it was all to do with the threat of tariffs. But we think that might be only part of the story.
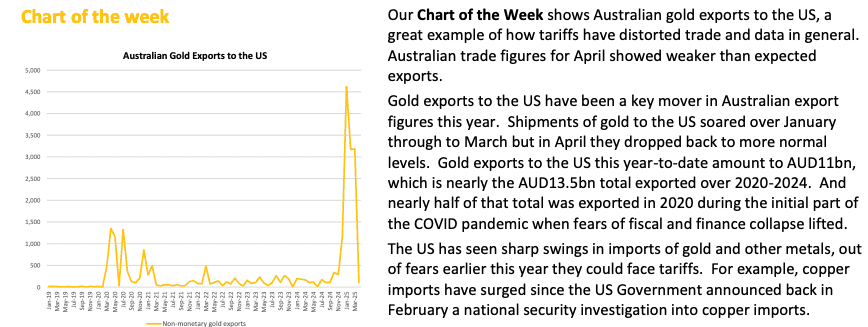
Chart of the Week: Silver Just Getting Warmed Up
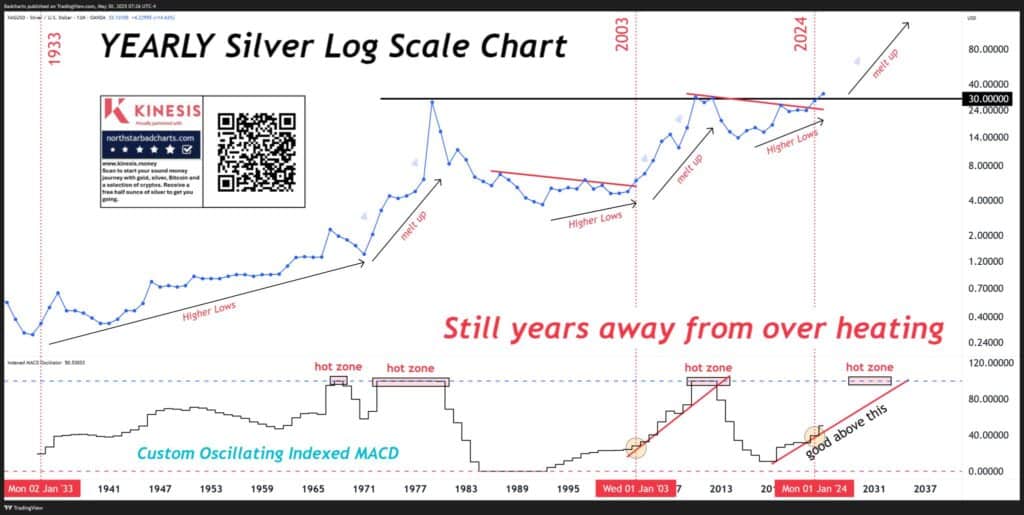
Source: Patrick Karim – NorthstarBadcharts.com
This 90-year log chart suggests silver’s major move is just getting started — and still years away from overheating.
📞 Talk to us today or learn more about how to buy gold – and especially silver – before it runs even higher: