USD silver has broken out to a 13 year high. NZD silver is pressing on all-time highs. Here’s why this 2025 breakout matters—and how far silver could go next.
Table of contents
Estimated reading time: 6 minutes
Silver Is Breaking Out in Both USD and NZD
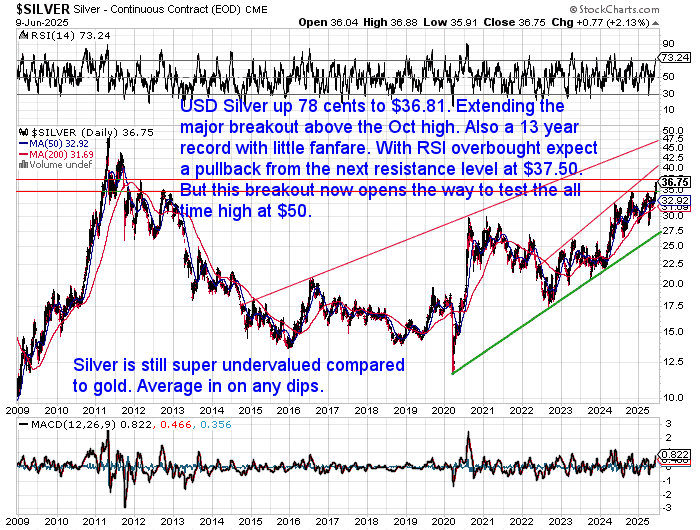
Silver has officially broken out in USD terms, pushing past its October 2024 high of $34.82—a level not seen since 2012. As of 10 June 2025, USD silver closed at $36.81, with momentum building toward the psychological barrier of $50.
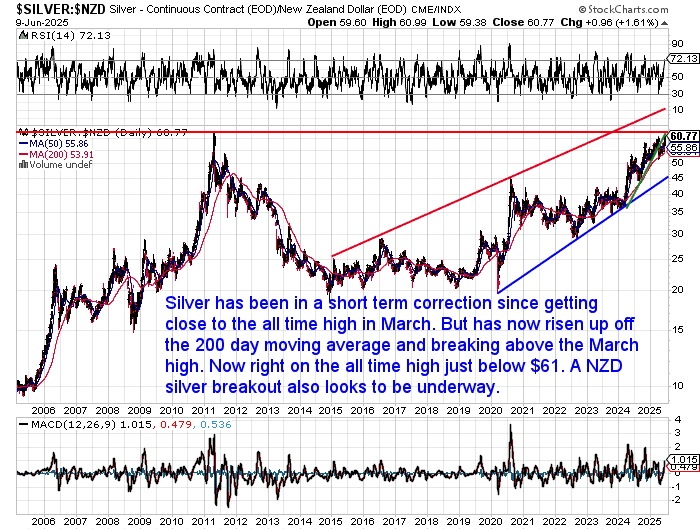
In NZD terms, silver is now above its March 2025 high, within striking distance of the 2011 all-time high above $60. After a healthy correction, it’s bounced off the 200-day moving average and is now pushing hard against resistance.
What’s also significant right now is who is starting to pay attention to silver. Recently, American tech investor David Bateman disclosed a massive 12.69 million ounce silver position—equivalent to roughly 1.5% of global annual supply.
Bateman cited a breakdown in trust, systemic fragility, and the growing need for sovereign (outside the system) assets. His X post summed it up clearly:
“There is less above ground silver than gold in the world; silver is essential for manufacturing, silver is in a 5 year structural demand / supply deficit. Silver’s day is coming very soon.”
This breakout suggests it may have arrived. Bateman is not just taking a punt. He’s made a deliberate move into monetary insurance—a hedge against the “biggest credit bubble in history”.
Why the 2025 Silver Breakout Is Gaining Serious Traction
We don’t think this is just a short term spike. 2025’s silver breakout is being driven by powerful real-world factors:
- Loss of trust in fiat: Rising global debt, geopolitical risk, and de-dollarisation have chipped away at confidence in traditional currency systems.
- Industrial strain: Silver demand from solar, EVs, and electrification is climbing fast—while mine supply struggles to keep pace.
Financial repression: Bateman notes: “There is no way the US can refinance its $28T in maturing treasuries in the next 4 years without an obscene amount of printing.” This realisation is pushing investors toward borderless, tangible assets that exist outside the financial system.. - Silver is rising while gold corrects: This jump in the silver price is happening while gold is correcting. As is often the case, silver is now playing catch up to gold’s 2025 surge.
- Silver market is tiny: Silver is only a $25 billion dollar annual industry. If just $5 billion (1.5%) of gold’s investment capital flowed into silver, the silver price would go stratospheric.
On the last point Bateman elaborates:
“That’s just 10 investors like me around the whole world. That means a single country investing in silver could cause a generational silver break out, or 10 large $500M investors.”
As noted in our January outlook, the stage was set. Now we are witnessing the move unfolding—and the charts are confirming it.
2024 in 60 Seconds: Breakout or Just a Test Run? (Click for a review of the 2024 breakout)
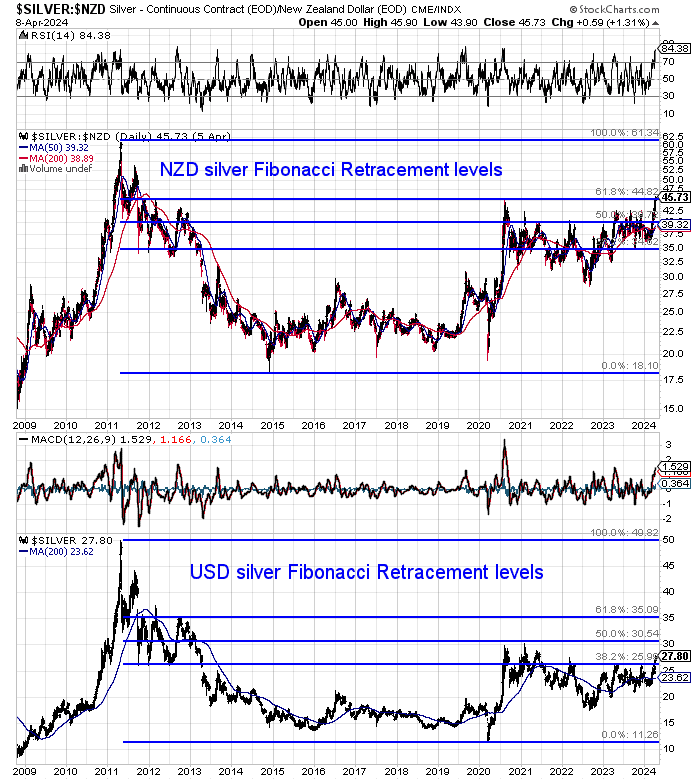
In 2024, silver broke above NZ$45 and surged toward NZ$60—exactly where long-term Fibonacci levels projected. By March 2025, NZD silver had come within cents of its 2011 peak, before pulling back in a textbook consolidation.
- Held the 200-day moving average
- Formed a classic bull flag
- Laid the groundwork for the current breakout attempt
The 2024 rally wasn’t a failure—it was the foundation.
What the Charts Are Saying – USD & NZD Silver Setup
USD Silver: Breaking Out with Room to Run
USD silver has cleared the $34.82 resistance from late 2024. Also completing a weekly close above $35. So a clear breakout and a further bullish confirmation.
- Price is well above its 50- and 200-day MAs
- RSI is overbought so silver could pull back short term. But MACD suggests room to run.
- Next resistance is at $37.50, then $50
If it breaks above the 2011 high, we may be looking at the start of a multi-year bull phase. (We’ll cover the price targets in the next section).
NZD Silver: All Eyes on NZ$61
Silver in NZD terms has rebounded sharply to $60.77. Above the March 2025 high and now just under the 2011 peak (intraday high of $62.24 , closing high of $60.85).
- A close above NZ$61 would confirm an all-time high
- Momentum is rising but not overextended – maybe a short term pullback?
- But the uptrend remains intact from early 2022
This looks like the last major resistance zone before “price discovery” begins.
What Comes Next? Could NZD Silver Break to New Highs?
NZD Silver Target: NZ$70–80
If NZD silver breaks above $61, there’s no historical ceiling. However, based on previous price moves—from the 2020 low ($20) to the 2021 high ($45)— we can project upside toward NZ$70–80.
And if USD silver clears $50, that momentum could carry NZD silver even higher.
USD Silver: Cup and Handle Targeting $100
A long-term cup and handle pattern on the USD chart has now triggered:
- The breakout from the “handle” in 2019 around $35 confirms the pattern
- The “cup” stretches from $50 (1980) to $3 (1993) back to $50 (2011)
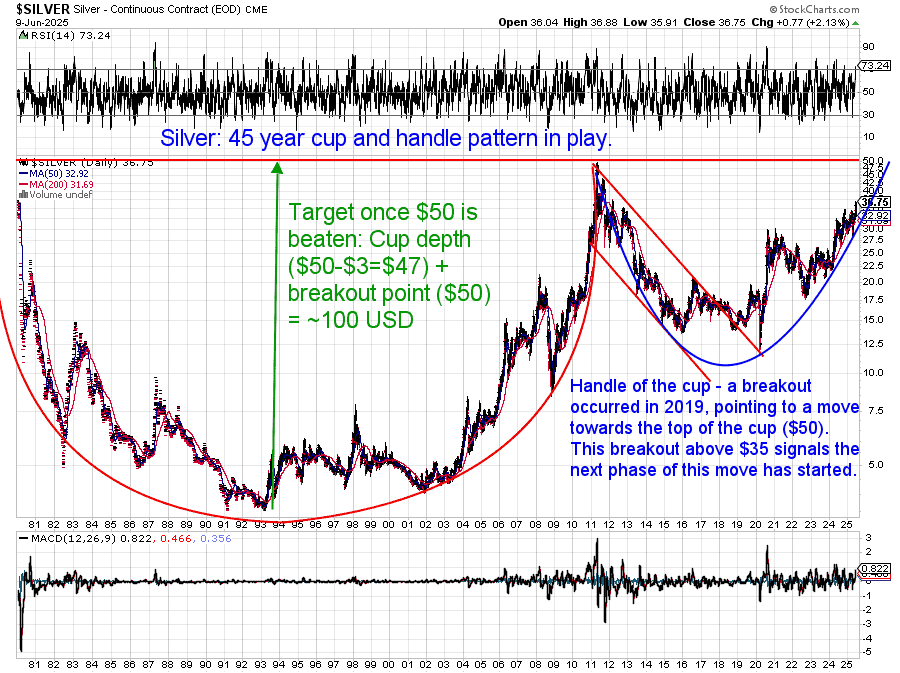
The target? Cup depth ($47) + breakout point ($50) = $97–100 USD
This might sound fantastic. But silver doubled in less than 12 months in both 1979/80 and 2011 following similar breakouts.We think even higher prices than these are likely. Check out our full breakdown of silver price projections: What Price Could Silver Reach?
What This Means for You – Don’t Wait for Confirmation
USD silver has already broken out. NZD silver is pressing at the ceiling of all time highs. David Bateman’s move shows institutional capital is starting to flow in.
So why are so many everyday investors still on the sidelines?
By the time mainstream headlines catch up, the biggest gains—and the most affordable bullion—are often gone. Silver markets can tighten fast once momentum builds. Premiums above spot then often rise too.
Silver is still historically cheap compared to gold, with the gold-silver ratio well above its long-term average. That gap often closes fast when silver breaks out—making this a rare window of value.
Best to be positioned before the squeeze.
At Gold Survival Guide, we don’t just sell bullion. We help you understand why it matters.
We educate first. Sell second.
Because in uncertain times, knowledge comes first. Join over 4000 others and receive our free Gold and Silver Weekly Wrap. Looking to buy? Get our daily price alerts and chart updates for free.
Editors note: Originally posted 24 July 2019. Updated 9 April 2024 with all new charts and prices and commentary. Last updated 10 June 2025 with a full re-write for the 2025 silver breakout.
Pingback: Silver is the Star this Week - Gold Survival Guide
Pingback: RBNZ Slashes OCR - The Race to the Bottom is Speeding Up and NZ Won’t Be Left Behind! - Gold Survival Guide
Pingback: Central Bank Record Gold Buying Continues - Gold Survival Guide