Prices and Charts
NZD Gold Highest Price Since November
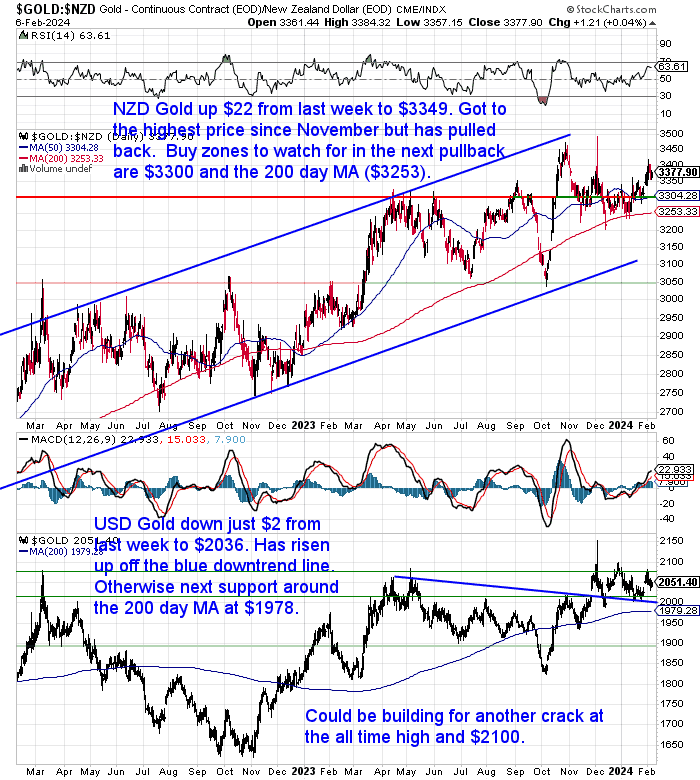
Gold in New Zealand dollars rose $22 from last week to $3349. Reaching the highest price since November, but pulling back a little in the last couple of days. Could run a little higher yet as not into really overbought on the RSI yet (Above 70). But buy zones to watch for in the next pullback would be $3300 which coincides with the 50 day moving average (MA). Then below that the 200 day MA around $3250. NZD gold clearly remains in the uptrend channel.
USD gold was down just $2 from last week. It has risen off the blue downtrend line and looks like it might be building for another crack at the all time high and $2100. So far is holding above $2000. Next support just below that is $1979.
NZD Silver Back at the Blue Uptrend Line – Excellent Buy Zone
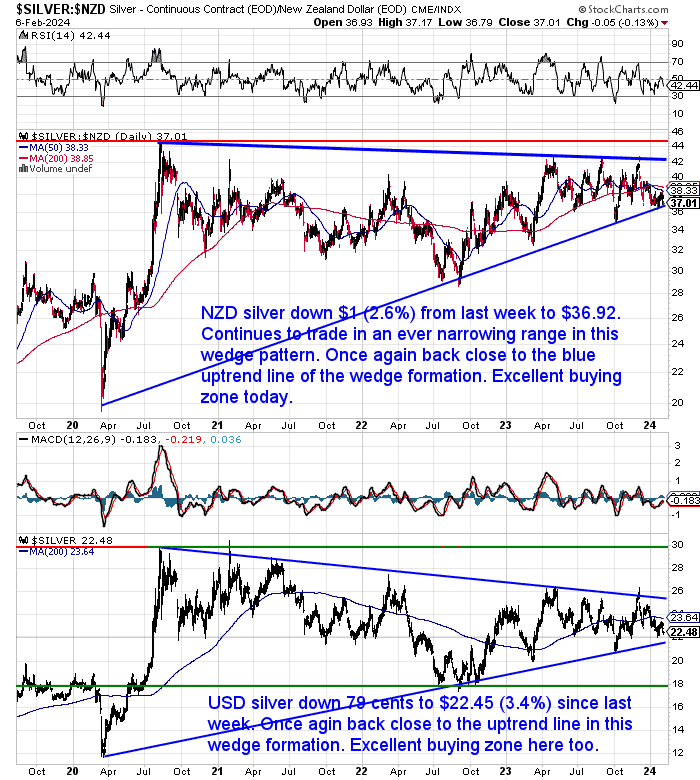
Meanwhile NZD silver was down over 2.5% for the week. Falling $1 to $36.92. Once again it sits just above the multiyear blue uptrend line. So also once again returning to what has been an excellent place to buy over the past 18 months.
The situation looks similar in USD terms. Also back close to the uptrend line after falling 79 cents (3.4%) in the past 7 days.
NZ Dollar Holding Around the 200 Day MA
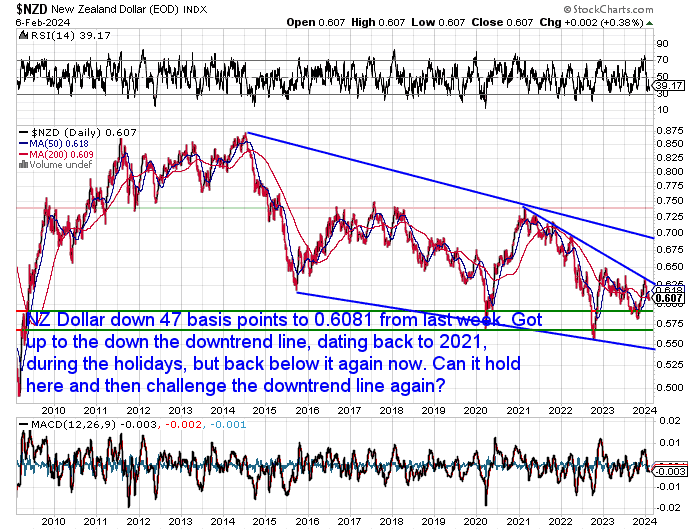
The Kiwi dollar was down 47 basis points this week to 0.6081. It continues to hover around the 200 day MA. Will it soon challenge the overhead downtrend line again?
Need Help Understanding the Charts?
Check out this post if any of the terms we use when discussing the gold, silver and NZ Dollar charts are unknown to you:
Continues below
—– OFFER FROM OUR SISTER COMPANY: Emergency Food NZ —–
Long Life Emergency Food – Back in Stock

These easy-to-carry and store buckets mean you won’t have to worry about the shelves being bare…
Free Shipping NZ Wide*
Get Peace of Mind For Your Family NOW….
—–
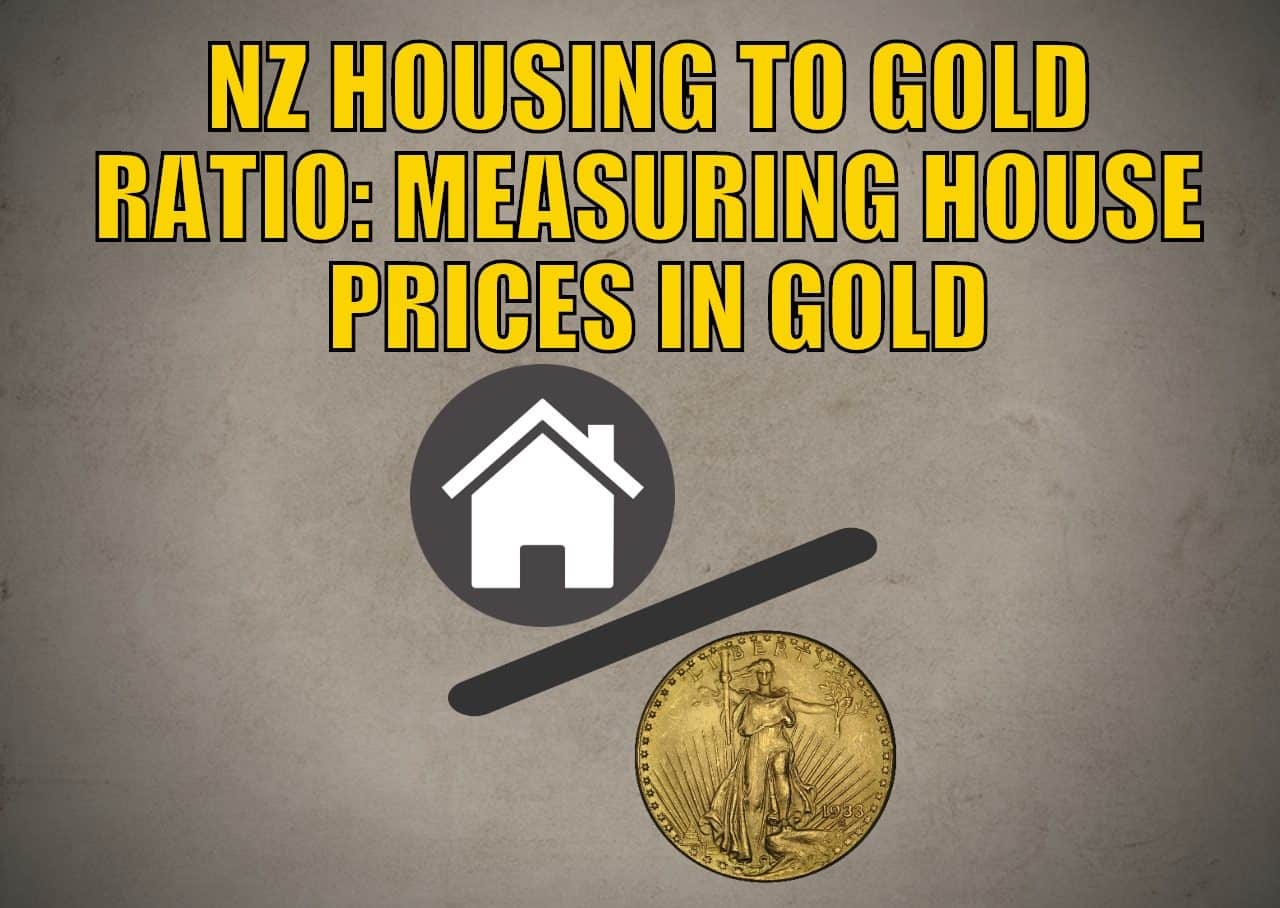
Measuring House Prices in Gold: How Has the NZ Housing to Gold Ratio Changed Over the Last Year?
In this week’s feature article, we explore the concept of measuring New Zealand house prices in terms of gold, rather than dollars. You’ll see how, since 2005, house prices have fallen when measured in gold. We also ponder the possibility of further house price declines and draw some comparisons between the New Zealand house price-to-gold ratio and that of other countries.
Then finally we compare some scenarios and look at if the ratio falls what price could gold reach if…
- Nominal House Prices Stay the Same – Gold Rises
- Nominal House Prices Plunge – Gold Holds Steady
- Nominal House Prices Fall – Gold Rises
- Nominal House Prices Rise – So Does Gold
Your Questions Wanted
Remember, if you’ve got a specific question, be sure to send it in to be in the running for a 1oz silver coin.
Higher Inflation in NZ Will the New Normal?
A headline from last week sounded a bit like someone had come over to our side of the table. That is the side that thinks we are in a longer term period of higher inflation:
Higher inflation in NZ will be ‘new normal’ – Salt Funds economist
“Global inflation has peaked, but it is expected to take more time before domestic inflation falls to within the Reserve Bank’s (RBNZ) 1 to 3 percent target range.
Salt Funds Management economist Bevan Graham said people should be wary of calls for
early and aggressive interest rate cuts, given current economic conditions and inflation.
“I think we are in a ‘new normal’, or even ‘old normal’ environment, in which inflation is going to be a bit tougher to keep under control.
“I think we’re going to see a period in which central banks [will need] to be a lot more active than … over the last 15 years, to keep inflation in check,” Graham said.”
Source.
But then later in the report we read…
“…Graham said the Reserve Bank was the first to hike interest rates, and may be the last to cut them, given a long list of negatives for the economy.
“We believe the first half of 2024 will be the toughest period yet for the economy. Ongoing pass-through of higher interest rates, slowing employment growth, weaker business investment, and softer global growth all paint a picture of broad-based weakness in activity in the period ahead.
“The bottom line is we believe the RBNZ has done enough tightening, but we don’t expect the first cut in interest rates to come until November this year.”
So to us that still reads like inflation will return to normal in the next couple of years. It may just take a little longer than previously thought.
But this isn’t actually significantly different to what even the Reserve Bank thinks. Maybe a year or so later than the RBNZ?
“The RBNZ has a target of maintaining inflation within a 1% to 3% band, but with a focus on keeping future inflation “near the 2% midpoint”.
Inflation has now been outside of the RBNZ’s 1% to 3% range for over two and a half years and the RBNZ’s not forecasting inflation to return within that band till the September quarter of this year. However, it doesn’t forecast that inflation will actually hit the 2% midpoint of the inflation target till September 2025 – in more than a year-and-a-half’s time.”
Source.
This same article above references an upcoming speech by RBNZ head Adrian Orr on February 16. The RBNZ said that in his address, Orr “will speak about the changing drivers of inflation over the past couple of years and the shift from transitory to more stubborn underlying inflation. He will also discuss why – despite these challenging years – the Reserve Bank continues to believe that a flexible inflation target centred on 2% still makes sense”.
But then we have bank economists such as BNZ head of research Stephen Toplis who questions the RBNZ’s desire to get inflation to the 2% midpoint of the target.
“…We would like to think that a better approach would be to simply be less dogmatic about getting inflation to the midpoint of the target band. Alan Bollard, when he was central bank governor was much more relaxed about using the full width of the band. This didn’t seem to cause too much problem,” he said.”
Source.
So Why Do We Think Higher Inflation Isn’t Over Yet?
So what is our rationale for questioning the RBNZ and bank economists’ theory that inflation will return to the 1-3% band and stay there?
Simply, because we had over 12 years of currency and credit creation from 2008. We doubt that just a year or 2 of higher interest rates will be sufficient to cancel out this massive increase in the currency.
Also because previous episodes of currency largesse have also taken a good long while to negate. We’ve shared similar charts to this before but it bears repeating:
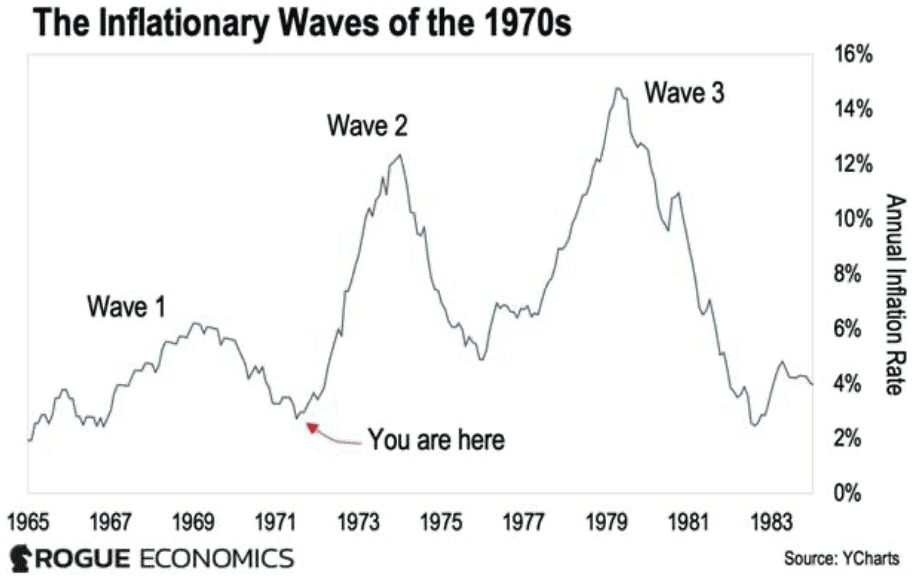
In the 1970s officials also said inflation was beaten multiple times and they were continuously proven wrong.
The first wave from 1968 to 1970 was the smallest. But, like now, it surprised people who had not experienced inflation before. (As the arrow in the chart shows we are likely at the end of this first wave now too).
The second wave was in the 1970s, pulling back in 1975 where in the USA then President Ford had everyone wearing “Whip Inflation Now” buttons. However the low in this drop was higher than the low in the previous wave.
Then the third and largest wave kicked off around 1977. We had talk of hyperinflation in the USA and interest rates as high as 20%. Rates had to stay high for multiple years in order to get inflation back under control.
But today, as we reported a few months back, US government debt interest payments are now over $1 trillion per year. In 2023 US government receipts were $4.4 Trillion. So the US government is close to spending nearly 25% of all its revenue just to service the national debt.
How will they deal with this massive debt load?
- Inflate it away
- Increase taxes
- Default on it
Option one would seem to be the easiest route. Hence our assessment that we are merely in a pause in a longer run high inflation cycle.
If the US central bank can’t simply steadily inflate the debt away that would leave the final option, to default on it. That would see the end of the US dollar as the global reserve currency and super high interest rates and massive inflation.
Hence why we don’t see any real way out other than via inflation.
Coming Soon: The Next Wave of Bank Failures?
It’s getting close to a year since the last round of bank failures in the USA. But we may be starting to see some of the troubles in US commercial property coming home to roost for the banks that hold this debt.
New York Community Bancorp’s stock price last week fell 38% in a single day.
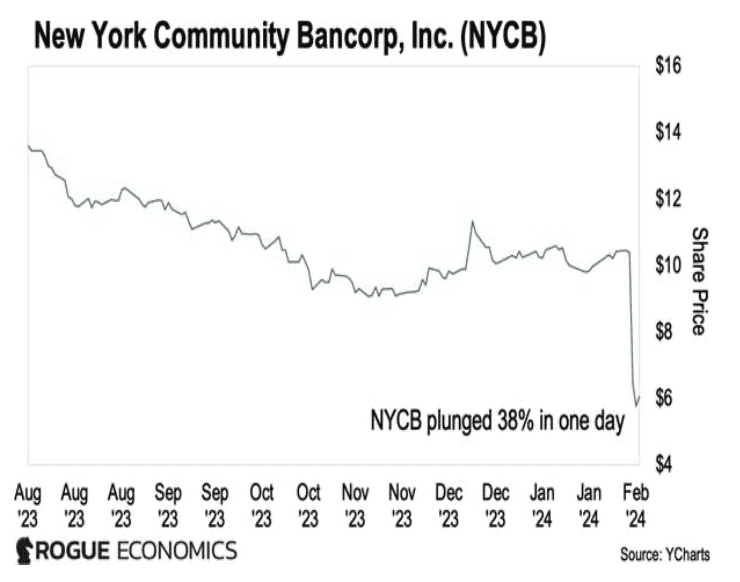
But troubles may not be restricted to just the USA. Last week Tokyo based Aozura Bank plunged 34%, after it was forced to write down the value of its exposure to the US commercial property.
In Hong Kong, the court’s decision “not to sanction Evergrande’s reconstruction implies a potential property crisis in Hong Kong, to which two British banks, HSBC and Standard Chartered have collateral exposure.”
Then Swiss Bank Julius Baer announced $700 million in losses as a result of failed Austrian real estate group Signa Holding.
To us this is reminiscent of the 2008 crisis, which saw bank failures come in waves over a period of years. Troubles in three major banks should ring alarm bells.
Do you have financial insurance in the form of the only no counterparty risk financial asset?
Get in touch for a quote for gold or silver or if you have any questions:
- Email: orders@goldsurvivalguide.co.nz
- Phone: 0800 888 GOLD ( 0800 888 465 ) (or +64 9 2813898)
- or Shop Online with indicative pricing
— Prepared for the unexpected? —
Never worry about safe drinking water for you or your family again…
New Australian Product: The Superoo 16 Litre Gravity Water Filter by Filteroo. Leak-free design with double the capacity of similar filters.
This filter will provide you and your family with safe drinking water for years to come. It’s simple, lightweight, easy to use, and very cost-effective. Comes complete with Stainless Steel Tap, Stand and Water Jug.
Shop the Range…
—–
|
Pingback: Tech Insiders Selling. Buying Gold and Prepping - Gold Survival Guide