Prices and Charts
NZD Gold Pulling Back From Last Week’s New All Time High
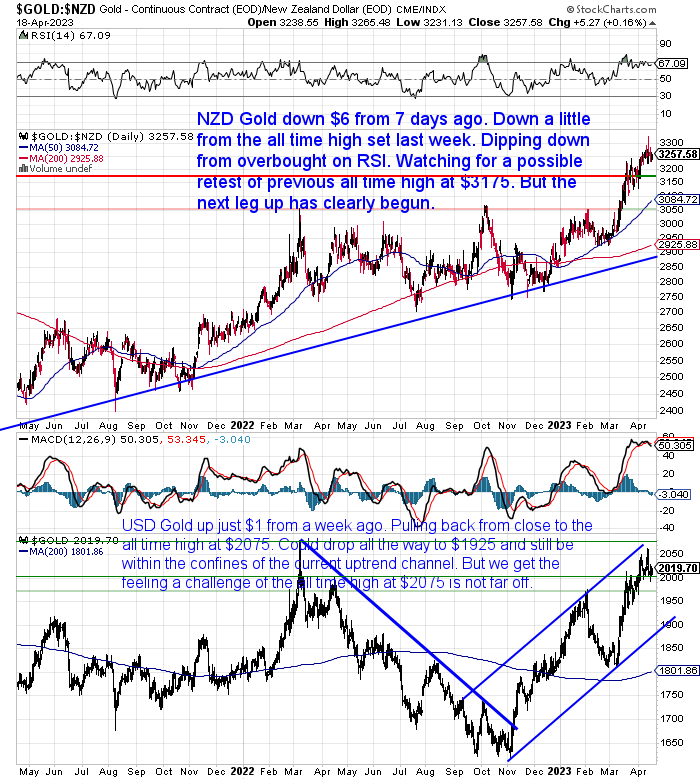
Gold in New Zealand dollars is down just $6 from 7 days ago. But it did make a couple of new all time highs in the last week and so is down a little further from those. Gold has also dipped down from overbought on the RSI overbought/oversold indicator (see the top of the chart below – now at 67, overbought is above 70).
We are still watching for a possible retest of the previous all time high at $3175. This is now the major support line in red/green on the chart below. But the next leg up has clearly begun. Gold is behaving very strongly. Plus as we noted last week, considering gold hit a new all time high, there is nowhere near the level of interest in gold compared to when the previous all time high was made in 2020. This is likely a contrarian indicator that there are higher prices to come. With the majority not really believing in the current gold rally.
USD Gold is up just $1 from a week ago. It has pulled back after getting close to the all time high at $2075. Below $2000, the next support level is at $1975. USD Gold could drop all the way down to $1925 and still be within the confines of the current uptrend channel. But we get the feeling a challenge of the all time high at $2075 is likely not too far off.
NZD Silver Remains Overbought After the Recent Breakout
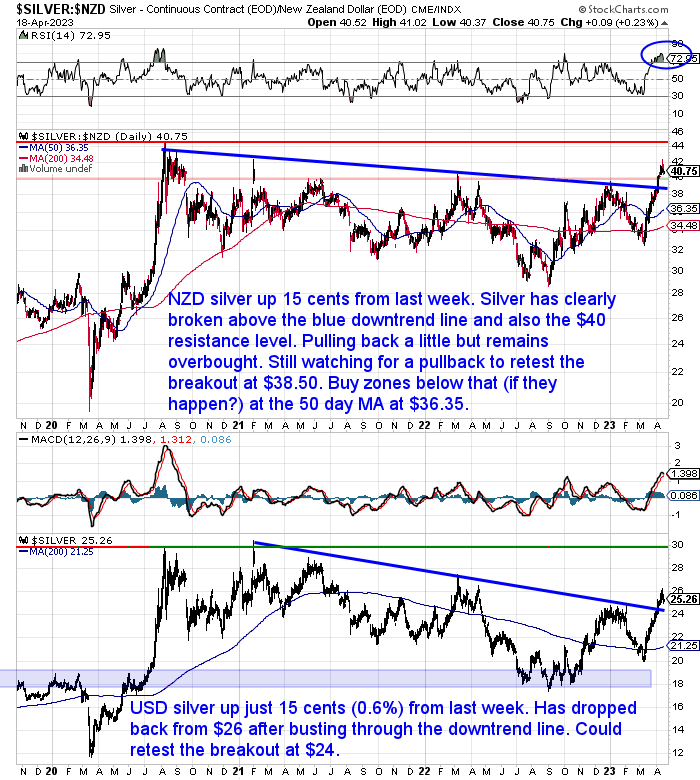
Silver in New Zealand dollars is up 15 cents from last week. Silver has clearly broken above the blue downtrend line and also the $40 resistance level. During the week silver got up above $41, before pulling back a little the last few days but remains overbought. We’re still watching for a pullback to retest the breakout at $38.50. Buy zones below that (if they happen?) are at the 50 day MA at $36.35 and the 200 day MA at $34.48. Although these levels will continue to rise (as they are moving averages after all), therefore the support levels will continue to rise.
USD silver rose just 15 cents (0.6%) from last week. It has dropped back from above $26 after busting through the downtrend line. Could retest the breakout from the downtrend line around $24.
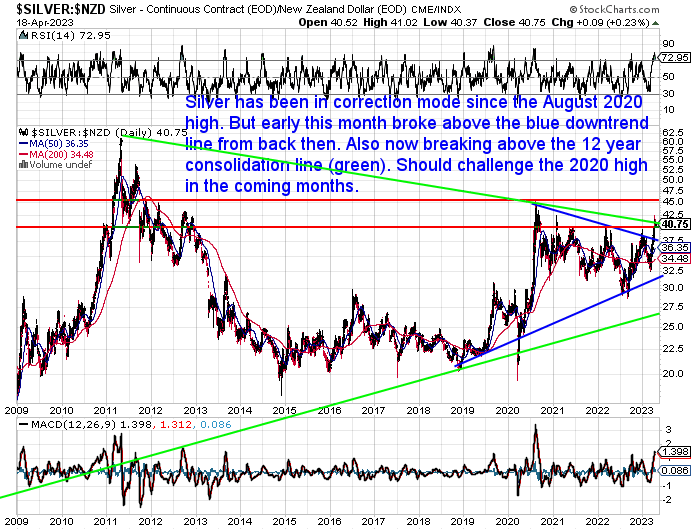
Since last week’s article was published (Silver Breakout or Silver Fakeout? – Where to Next for Silver in 2023?), we noticed another significant event has happened for the price of silver in NZ dollars.
In the chart above you can see the breakout from the downtrend line from 2020. However there is also a much more significant breakout underway now too. Shown by the green lines in the chart below, NZD silver is breaking out of a 12 year consolidation pattern.
So while we are watching for a pullback and a retest of the breakout from the 2020 downtrend line in the short-term, we think the odds are getting better of a challenge of the 2020 high in the coming months.
NZ Dollar Remains Range-Bound
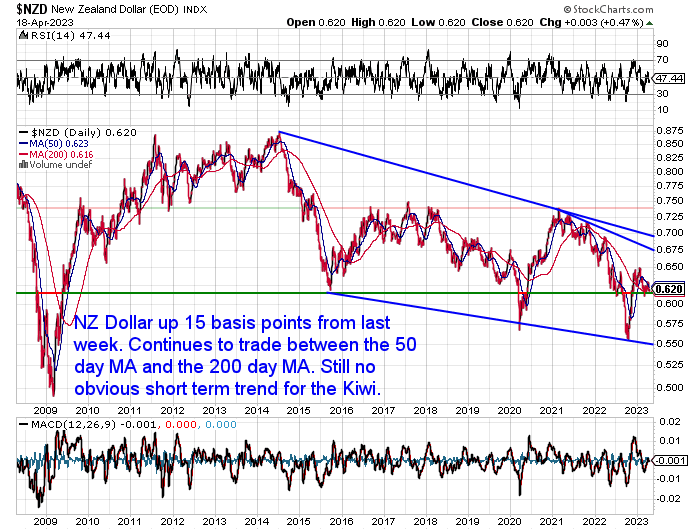
The NZ Dollar was up 15 basis points from 7 days ago. But it remains range bound between the 50 and 200 day MA’s. So still no obvious short term trend for the Kiwi. Odds favour it strengthening against the USD later in the year.
Need Help Understanding the Charts?
Check out this post if any of the terms we use when discussing the gold, silver and NZ Dollar charts are unknown to you:
Continues below
—– OFFER FROM OUR SISTER COMPANY: Emergency Food NZ —–
Long Life Emergency Food – Back in Stock

These easy to carry and store buckets mean you won’t have to worry about the shelves being bare…
Free Shipping NZ Wide*
Get Peace of Mind For Your Family NOW….
—–
Gold to S&P500 Ratio – Breaking out?
At the start of April we discussed the DOW to Gold ratio, comparing the price of the Dow Jones Industrial Average (DJIA) to the price of an ounce of gold.
Here’s another way to look at shares vs gold. A chart of the ratio of gold price to the S&P500 index.
The S&P500 may be the better index to use, as it is a broader measure of the US stock market. Encompassing 500 large-cap American stocks vs the DJIA only tracking 30 of the biggest American companies.
Anyway, dating all the way back to 2011, another breakout may well be close to happening here.
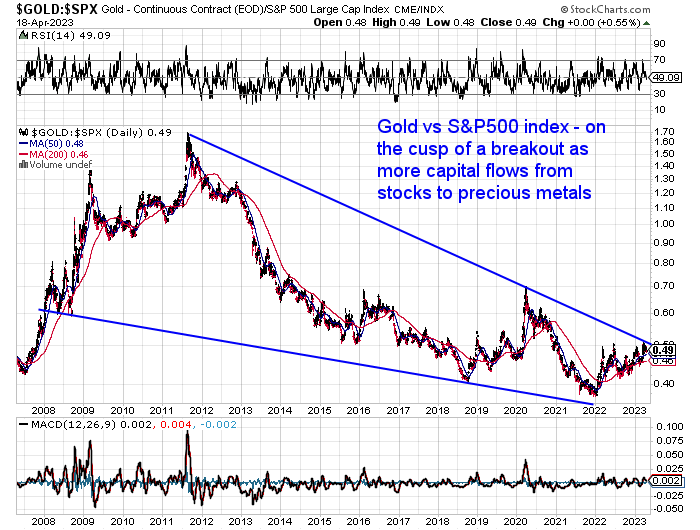
This chart shows that since 2022, more capital is moving into precious metals rather than the US stock market. A breakout here would be quite significant.
Gold Miners Starting to Rise Too – But Not All
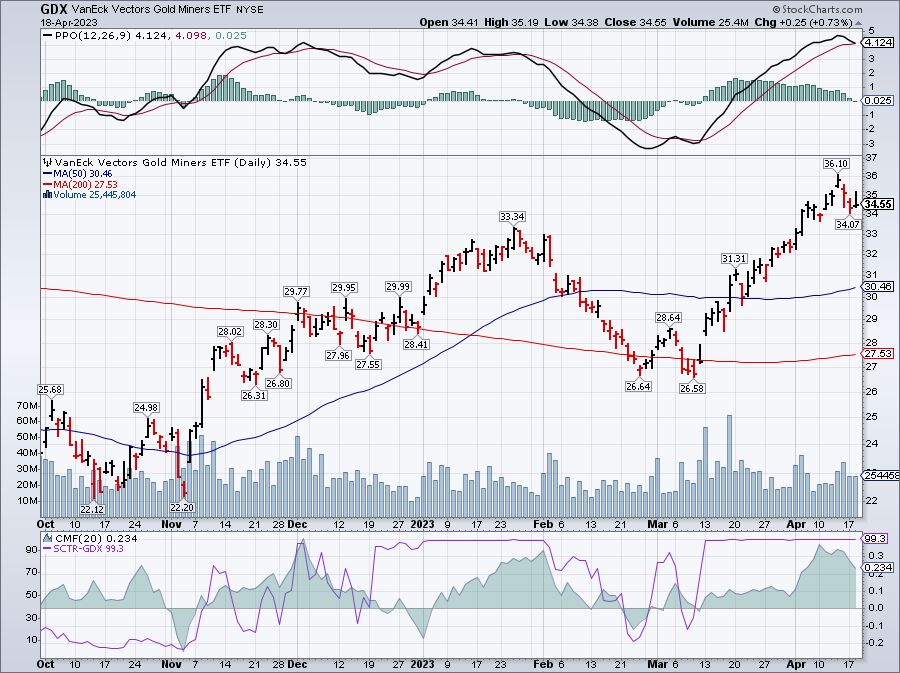
Miners and mining indexes like GDX and GDXJ have jumped sharply over the past month or so. Continuing their rise since bottoming in October.
So more people might be considering investing in shares in gold and silver mining companies. We received a question from a reader on why her gold and silver miner wasn’t rising given the gold price has been lately…
“I have some shares in an American gold and silver mine, apparently it is very high quality product coming out of the mine. Bearing in mind [central] banks around the world are buying up gold like never before, why are the shares in the gold mine plummeting rather than going up? It seems weird to me that something that is in demand is going down in (share) value. Any ideas???”
Here are our thoughts…
In general gold and silver miners have been rising lately.
For example GDX is a gold miners ETF
And SIL is a silver miners ETF
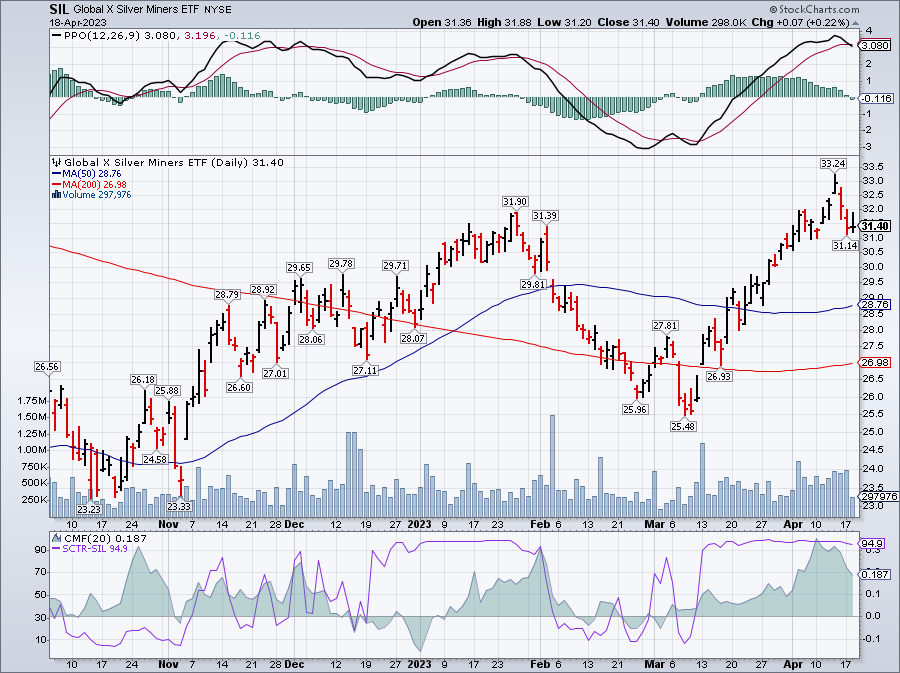
You can see their share prices have been rising lately.
But a mining company is not only driven by the price of the raw product they sell.
So it could be other news that is causing your company to fall in price. Such as lower than expected results, higher costs, discoveries that haven’t panned out. Poor decisions by management etc. Then there are also things like diluted ownership through issuing more shares.
The post below also explains other risks involved with mining companies.
Here’s what’s covered:
- Firstly, What are Gold Shares or Gold Stocks?
- Disadvantages of Gold Mining Stocks Compared to Gold Bullion
- Advantages of Gold Mining Stocks Compared to Gold Bullion
- Wealth Protection Versus Wealth Creation
- Wealth Creation – The Importance of Timing When Buying Gold Mining Shares
- Long Term Comparison of Gold Bullion vs Gold Mining Shares
- Short Term Comparison of Gold Bullion vs Gold Mining Shares
- Conclusion: Bullion versus Gold and Silver Miners
So without knowing the specific company it could be any number of reasons why the price is falling. If you want to share the name we might be able to comment on it if we know something about it.
But just realise that it is not only the price of gold and silver that will drive the share price of an individual mining company.

Your Questions Wanted
Remember, if you’ve got a specific question, be sure to send it in to be in the running for a 1oz silver coin.
High Inflation and a Recession to Come – Stagflation Anyone?
Various banking analysts think inflation in New Zealand has peaked or is close to.
“Figures due out on Thursday should show inflation broadly flat-lining, if the Reserve Bank and an experimental tool developed by Massey University prove on the money.”
Source.
However most now expect Inflation rates to stay higher than previously thought:
“We won’t get the official data until later in the week, but economists at New Zealand’s major banks are uniformly predicting that inflation will stay stubbornly high when figures are released on Thursday. The big four Australian banks, along with KiwiBank, all predict that the Consumer Price Index (CPI) for the first quarter of 2023 will show an annual increase of somewhere between 7% (WestPac) and 7.2% (ANZ and ASB). If those predictions prove correct, that will be four consecutive quarters (also known in the industry as “a year”) of inflation sitting around 7%, which suggests that the new emphasis on bread-and-butter issues has had no impact on the cost of bread and butter. In fact, the biggest driver of inflation over the past year has been the cost of bread, butter and other foodstuffs.”
Source.
As usual the causes of the high inflation are explained away as mostly due to uncontrollable factors:
High food costs – ANZ says due to “extreme weather events, rising input costs, geopolitical tensions and ongoing labour shortages”.
Cyclone Gabrielle – “construction costs, rents and even house prices are all likely to hold steady, if not start marching up again”.
But now we are seeing what the economists call “non-tradeable inflation”. That is Domestic Inflation – as opposed to tradable inflation which is imported via fuel and commodity prices.
So as a result:
“Stubbornly high inflation will require higher interest rates for longer even at the risk of squeezing the economy more tightly than desirable, according to a new report. Economics consultancy Infometrics is forecasting inflation holding up at 6.6 percent by the end of the year, close to 4 percent at the end of next year, and not back inside the Reserve Bank’s target 1 to 3 percent band until mid-2025.”
Source.
The infometrics report is perhaps at the more harsh end of the spectrum saying inflation won’t return to the target 1-3% until mid-2025. But everyone we’ve read is just treating this current surge like a one off blip and we’ll be back to low inflation in a couple of years.
We still think it’s more likely we’ve changed to a secular trend in high inflation that will be with us for some years. Probably along with higher interest rates. Which in turn are seriously slowing down the NZ economy:
“Independent economist Cameron Bagrie says there will be “no free lunch” as ASB predicts the potential recession could be deeper and more prolonged than originally thought. The Reserve Bank last year predicted its engineered recession would see the economy contract by 1 percent over 12 months from April.
But on Tuesday, ASB bank predicted the economy would contract about 2 percent by early next year.”
Source.
This is sounding an awful lot like stagflation to us. High inflation and a sluggish economy in recession. That is what people should be preparing for we reckon.
But Inflation is a problem everywhere in the world at the moment. And it seems to be regardless of whether a country has been hit by a cyclone and harsh weather. Could it be that persistent inflation is actually caused by all the currency that has been created by just about every central bank on the planet in recent years? We haven’t seen too many bank economists discussing that, so maybe we are barking up the wrong tree?
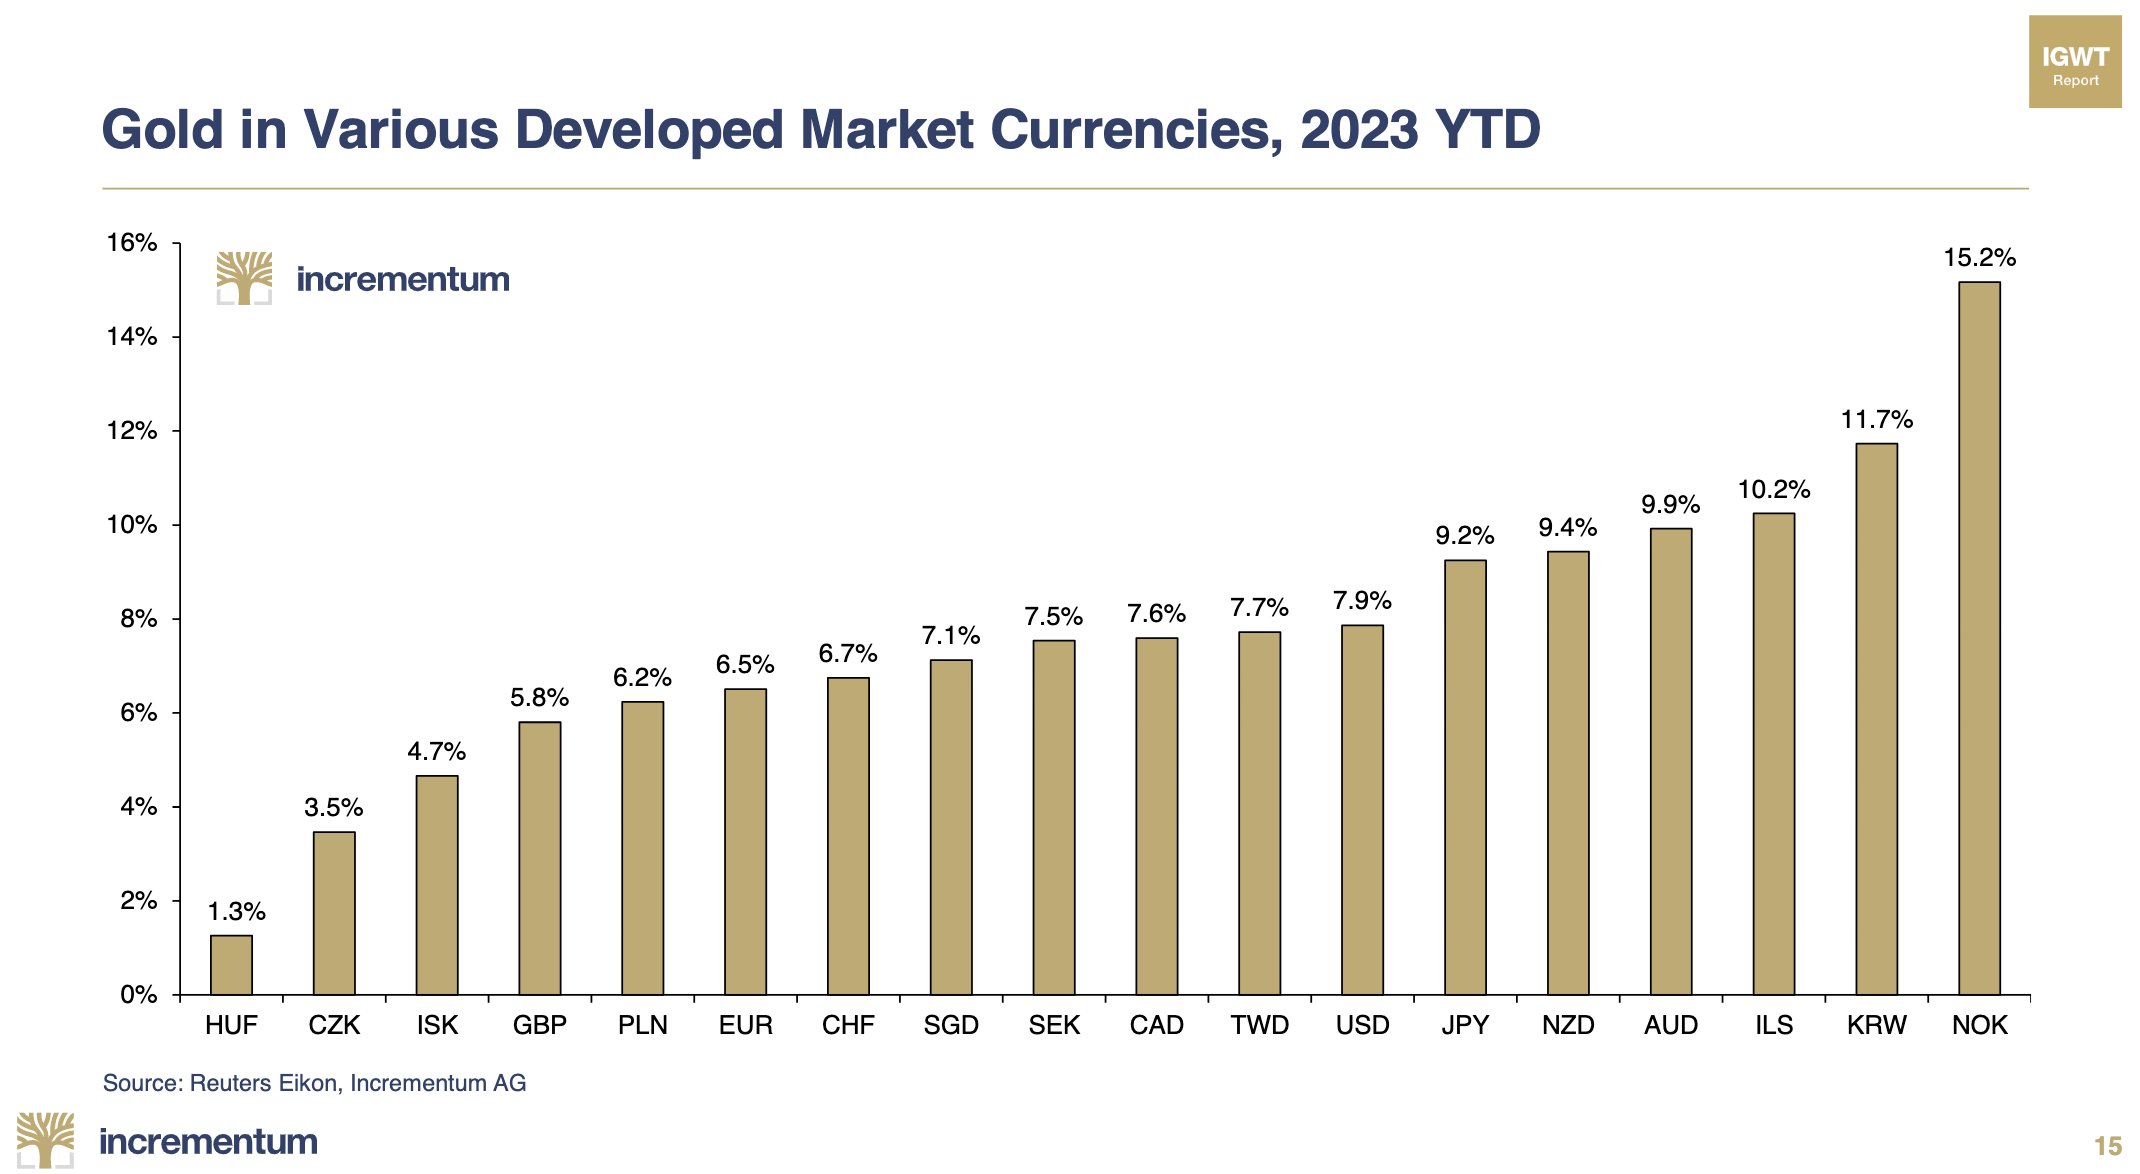
Gold in NZD YTD 2023 Versus Other Developed Market Currencies
Here’s how gold is performing in many currencies including the NZ Dollar for the year to date 2023 (this chart was from 11 April and NZD gold is now up around 12% YTD). Doing better than the current rate of inflation (7%). Which is more than can be said for the sharemarket (NZX50 up 3.6% YTD). Or housing (down 3.9% to the end of March).
Source.
If you think inflation could stay higher for longer, then gold is likely headed higher too.
It’s not going to be a straight line up for gold (and especially gold’s more volatile cousin silver). So use any pullbacks to get on board.
Have you got enough inflation protection?
Get a quote on gold or silver products:
- Email: orders@goldsurvivalguide.co.nz
- Phone: 0800 888 GOLD ( 0800 888 465 ) (or +64 9 2813898)
- or Shop Online with indicative pricing
— Prepared for the unexpected? —
Never worry about safe drinking water for you or your family again…
The Berkey Gravity Water Filter has been tried and tested in the harshest conditions. Time and again proven to be effective in providing safe drinking water all over the globe.
This filter will provide you and your family with over 22,700 litres of safe drinking water. It’s simple, lightweight, easy to use, and very cost effective.
—–
|