One of our readers posed a question about the performance of the NZD gold price compared to inflation, along with the break-even timeframe for their investment. In response, we’ve delved into the data and created a chart that illustrates the NZ CPI Index vs the NZD gold price. In this article, we’ll examine the findings and provide insights into the performance of gold in relation to inflation.
Table of contents
Estimated reading time: 5 minutes
Reader Question: NZD Gold Price vs Inflation
Our reader asked:
[Note: When our reader says buying at retail and selling wholesale, what they are actually referring to is that to buy gold you pay just over the spot price and to sell it you get just under. So there is a spread to take into account. Although this is only a few percent. Read more about the spot price: What Does Gold Spot Price (Or Silver Spot Price) Mean?]Have you a graph showing nz gold price v inflation ,say since 2000. Am still trying to get my head around buying precious metals at retail rate and selling at wholesale, how long it would take to even break even on the investment.
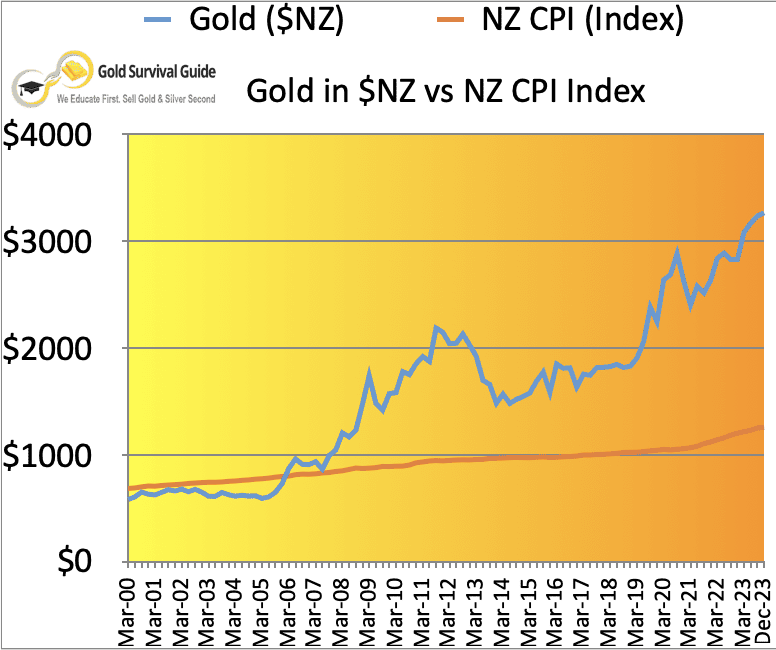
The NZD Gold Price and CPI Index Chart
Here’s the chart we put together using the New Zealand CPI data from the RBNZ website. The latest Consumer Price Index Data for the December 2023 quarter was just released yesterday. So this chart is up to that date.
Analysing the Gold vs Inflation Data
Based on the chart, it’s evident that the NZD gold price has significantly outperformed the rate of inflation in New Zealand since the year 2000. However, to gain a clearer understanding of the correlation between the two, let’s examine the details.
Comparing the CPI and Gold Performance
The CPI index, starting at a value of 687 in March 2000, has risen to 1259 as of the latest CPI data for December 2023. This represents a total percentage change of 83% over the 23-year period. In contrast, the NZD gold price showed a significantly higher increase, rising by 460% during the same timeframe. (Starting at $584 and ending at $3265).
| % Change Since March 2000 | |
| CPI Index | 83% |
| Gold ($NZ) | 460% |
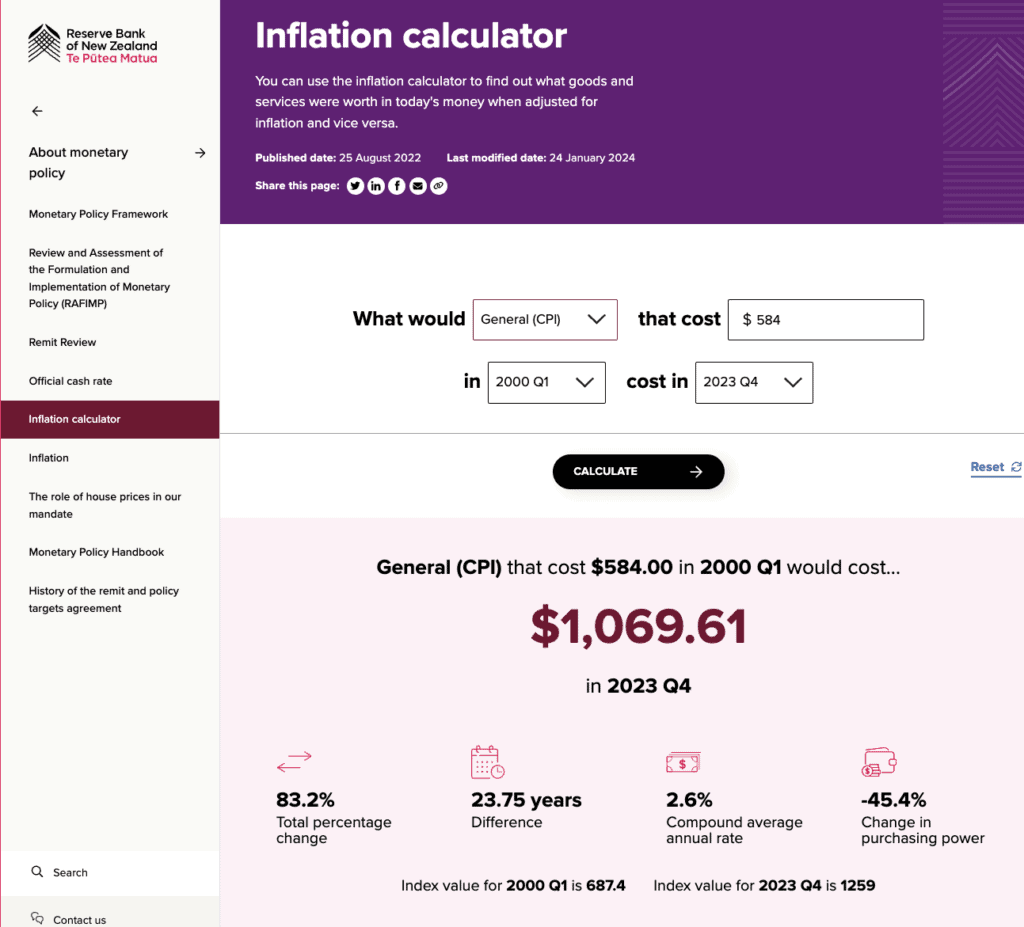
We compared this data against the RBNZ inflation calculator.
It has the same starting and ending values for the CPI index that we used to create the chart. See the bottom of the screenshot below. We input $584.00 as the Q1 2000 starting value (i.e. the gold price at that date). It shows that the gold price would need to have reached $1,069.61 in Q4 2023 to have kept pace with the CPI. So at a price of $3265 in December 2023, the gold price is far ahead of that.
Break-Even Considerations When Buying Gold
Although in our view the CPI likely under-reports true inflation, the NZD gold price has demonstrated significant growth, even when considering a higher inflation rate. Even doubling the reported CPI rate, the NZD gold price still vastly exceeds the rate of inflation. So when buying gold past data should give some confidence that the breakeven compared to inflation looks very achievable.
The breakeven between buying and selling is also not much of a factor. Since the buy/sell spread we mentioned earlier (even using say 3-5%) is much much less than the rise over time in the gold price.
On top of this, it’s important to note that gold often correlates more closely with real interest rates than with inflation alone. Or put another way, when the after inflation interest rate is negative or close to zero, gold often performs best. This makes sense since gold pays no dividends. So when you also get no return after inflation from the bank, gold “goes up” in price.
Therefore, in the short term the gold price might not match or better the CPI, since it correlates better to real interest rates. However, over the longer run the data shows the gold price clearly beats inflation by a wide margin.
Other Related Information Worth Exploring
To gain further insights into the relationship between gold, inflation, and other economic factors, we recommend exploring the articles we’ve published on our website. One article examines the connection between real interest rates and gold prices in New Zealand, shedding light on potential buying opportunities. Another article delves into the relationship between money supply, inflation, property, and gold, giving a comprehensive view of these interrelated topics.
Conclusion
Based on the data analysis above, it’s clear that the NZD gold price has outperformed inflation over the past two decades. Even if the government CPI does not capture the true extent of inflation, gold has still proven to be a valuable asset for preserving wealth. Because it has beaten the rate of inflation by a wide margin. As always, it’s essential to consider various economic factors and conduct thorough research before making investment decisions. But be sure to make up your own mind.
We hope this article provides valuable insights into the performance of the NZD gold price and its relationship with inflation. Should you have any further questions or require additional information, please don’t hesitate to get in contact.
Editors note: First published 11 July 2023. Last updated 25 January 2024 with the latest CPI inflation data and gold price as of December 2023.
Pingback: Here’s Why Even If Inflation Drops to 3%, It’s Still Likely Going Higher Again - Gold Survival Guide
Pingback: New “Gold Rush” for New Zealand? - Gold Survival Guide