Prices and Charts
Gold Breaks Above $2550 Resistance Level With Ease
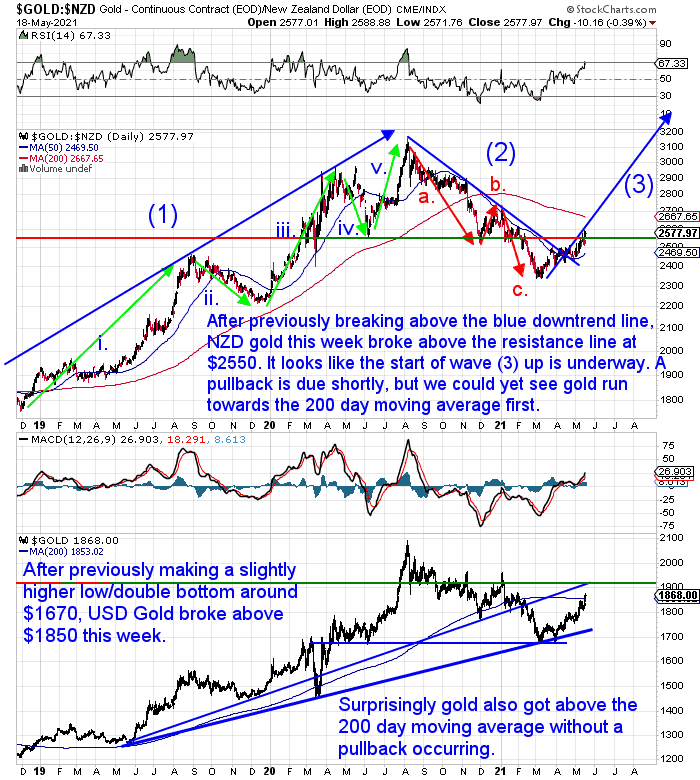
Gold in New Zealand dollars this week surged 2.3% to close above the overhead resistance level at $2550 with some ease. We thought there could have been a pause there – but not so.
The RSI is very close to overbought (>70) now, so a pullback could be expected. However NZD gold may now run on towards the 200 day moving average (MA) at $2667 before we see a meaningful pullback.
Regardless of how it plays out the next up-leg is clearly underway. It’s safe to say the correction from the August 2020 high is over. Any pullback is a buying opportunity now.
Silver Surging Through Key Overhead Resistance
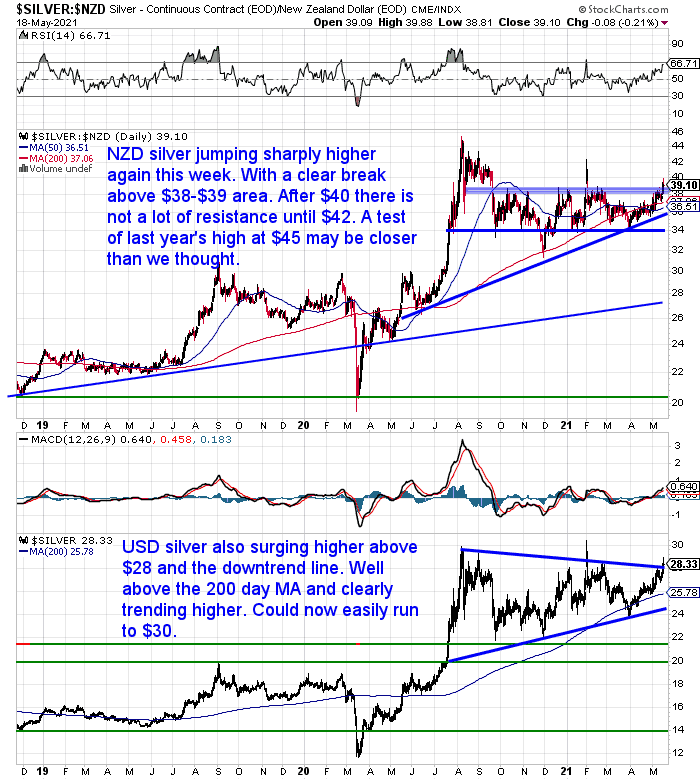
Silver in NZ dollars also charged higher earlier this week. With a clear break above the $38-$39 we were watching for. As we said last week there is now not much resistance until $42. A test of last year’s high of $45 might not be that far off now.
Kiwi Dollar Down Half a Percent
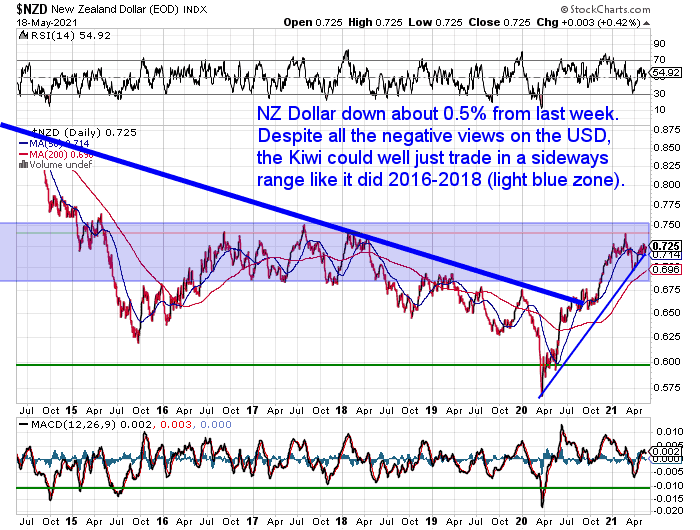
The New Zealand dollar was down a shade under 0.5% this past 7 days. But it is still clearly above the uptrend line. So this points to the trend still being up for the Kiwi.
However with all the negative views on the US dollar, the Kiwi dollar could well just trade sideways much like it did in 2016-2018 (light blue zone on the chart). So our guess is the exchange rate may not have too much of a bearing on the direction of local gold and silver prices.
Need Help Understanding the Charts?
Check out this post if any of the terms we use when discussing the gold, silver and NZ Dollar charts are unknown to you:
Continues below
—– OFFER FROM OUR SISTER COMPANY: Emergency Food NZ —–
NEW: Certified Organic Long Life Emergency Food

This easy to carry bucket has 90 servings of organic breakfasts and mains
Free Shipping NZ Wide
Get Peace of Mind For Your Family NOW….
—–
Gold Cycles vs Property Cycles in 2021: When Will Gold Reach Peak Valuation?
The past few weeks we’ve featured articles on the New Zealand housing to gold and housing to silver ratios.
These simply measure house prices in ounces of gold rather than in dollars. A useful way to look at property over the long term when dollars are being constantly devalued. But the charts in these articles also show when to move from one asset class into another.
This week’s feature article follows on from the above 2 posts. Looking in depth at how long term property cycles compare to gold cycles.
It covers:
- The 18 Year Real Estate Cycle or “Property Clock”
- Gold Cycles: Gold Bull Market 1970’s vs 2000 to Date
- When Will Gold and Silver Reach their Peak Valuations?
- Where Might the Gold Price End Up at the End of This Cycle?
- The 14 Year Property Cycle and the Current Precious Metals Cycle
- Sovereign Default Cycles and Gold
- Prepare for a Repeat of the 1970’s?
Record Gold Imports into New Zealand as Investors Seek Haven
An interesting article featured on Stuff on Monday. It outlined how…
“Customs figures reveal an unprecedented $242 million in gold was imported to New Zealand in the past 12 months, as the world’s wealthy seek the security of the world’s oldest investment product.
Most came from Australia ($127m) but there was also $46m from the US and $16m from Japan, in the 12 months to March.”
Source.
However, the main thing that struck us about this article wasn’t the huge increase in gold imports. That wasn’t a surprise as we have sold and imported much more in the last 12 months too. So a surge in imports was to be expected.
What we thought unusual was to even have a bank economist comment in a report on gold – let alone talk about the “end game”! Here was the quote from ANZ’s chief economist Sharon Zollner who said people were seeking the certainty of gold in uncertain times…
“Dramatically higher government debt in many countries funded by expanding money supplies has perhaps raised question marks for some about the endgame, and in particular the ultimate trustworthiness of fiat money in terms of holding its value through thick and thin,” she said.
“Gold has been the ultimate safe haven for wealth for centuries – it may not be as trendy as cryptocurrencies, but it seems it hasn’t completely lost its lustre.”
Read that again, especially the bit about the “endgame” and raising questions about the “ultimate trustworthiness of fiat money”!
Very surprising indeed to hear that from a bank economist in this country.
Your Questions Wanted
Remember, if you’ve got a specific question, be sure to send it in to be in the running for a 1oz silver coin.
RBNZ Doesn’t Know What Impact Low Interest Rates Have Had on Inequality in NZ!?
A new analytical note out from the RBNZ reported that they don’t know what impact low interest rates have had on inequality in New Zealand.
Titled, Low interest rates – who are the winners and losers? The report looks at various studies overseas and says their conclusions are “indeterminate”. It also says the RBNZ has not yet studied the effects of their low interest rate policy in New Zealand.
This is really quite laughable. It doesn’t take a team of economists, or serious studies to work out the impact of low interest rates!
Of course they are going to increase in equality!
Low interest rates benefit those with debt. They certainly don’t benefit those renting houses and trying to save a few bucks each paycheck.
Low interest rates also boost house prices. Just look at what has happened in the past year! This certainly doesn’t help those renting these houses. Rents will rise as house prices do. Again look at what has happened over the past year.
Sure anyone with a mortgage (and who still has a job) will have benefited from lower repayments. But we are talking about inequality. So it’s disingenuous to say some households will have done better and this balances things out. Those at the bottom are most certainly going to be worse off as a result of lower interest rates.
And this is without even talking about the impact of the RBNZ currency printing program. This will end up devaluing the dollar in the coming years. Perhaps significantly. Higher rates of inflation are likely.
Again this will hurt those without any assets. As their cost of living rises and likely their wages don’t keep up. Meanwhile they have no asset price increases to balance this out.
US numbers clearly show the impact of the Fed’s QE:
“Since 1995 the bottom 50% have added $1.5T to their combined wealth while the top 1% have added $30T to their combined wealth.
That’s $30T going to 3.2M people versus $1.5T going to 165.5M people.
The wealth gap has never been wider.
Let’s keep printing.”
Source.
Anyway rant over. But what a joke!
Meantime if you have cash, make sure you are benefiting from what the central bankers are doing. Convert it to assets that will thrive under low interest rates and currency devaluation.
Silver might be a good one for that. Even though it’s hard to come by at the moment. Local suppliers have no 1kg silver bars available even for back order currently. The only local silver available is 5oz bars, but there is a 4-8 week wait for them.
But we currently have ABC serial numbered 1kg bars on a 2 week back order. These are actually cheaper than comparable bars we’ve seen advertised lately in the USA.
However there are plenty of options if you’re after some gold.
- Email: orders@goldsurvivalguide.co.nz
- Phone: 0800 888 GOLD ( 0800 888 465 ) (or +64 9 2813898)
- or Shop Online with indicative pricing
— Prepared for the unexpected? —
Here’s how to always have clean fresh drinking water on hand.
The Sport Berkey Water Filter Bottle – $69 Delivered
Ideal for travel. Driving, camping, backpacking.
Free Shipping NZ Wide.

—–
|
Pingback: When Did New Zealand Switch to Fiat Currency? How Has the New Zealand Monetary System Changed Over the Past Century? - Gold Survival Guide
Pingback: Runaway House Prices: The ‘Winners and Losers’ From the Pandemic - Gold Survival Guide