
Gold and silver have been falling recently. And gold has been falling for longer than silver. So today we look at whether gold and silver in New Zealand dollars may be about to bottom. Then we look at what’s next for gold and silver in NZD…
Table of Contents
- Why Have Gold and Silver Been Falling?
- Where to From Here for Silver in NZD?
- Should You be Buying Silver With Your NZ Dollars Here?
- How About the Yellow Metal? What’s Next for Gold in NZ Dollars?
- Should You be Buying Gold in NZD Here?
- Final Positive (and Contrarian) Indicator For Buying Gold and Silver Now
Estimated reading time: 9 minutes
Why Have Gold and Silver Been Falling?
Long term interest rates have been rising recently. As we noted recently…
“…rising interest rates are being blamed for the recent weakness in gold. The argument is inflation rates remain low (well at least according to government statistics), but interest rates are rising. So the real interest rate (after inflation) is falling. This makes gold less attractive.
This may be a factor. However gold is in a corrective phase after a strong run higher last year. So gold could be just going where it needed to in order to shrug off the weak hands.
Also as we reported last week, inflation expectations are increasing both here and abroad. And so are the prices of key goods such as food and commodities. But government CPI figures do not reflect this, as all the non essential goods in the CPI measure water down the price rises in these necessities.
An ANZ survey last week showed: Business confidence is flat – but inflationary expectations are not. There is “Little sign of inflationary pressures abating”.
ANZ Business Outlook survey shows a ‘jaw-dropping’ 67% of retailers expect to increase their prices. Source.So measures of actual inflation may simply be lagging the increase in interest rates. Gold will likely turn higher once investors realise interest rates have been ticking higher due to inflationary fears.”
Read more on gold and interest rates: Real Interest Rates vs Gold Prices – What Can They Tell Us About When to Buy Gold in New Zealand? [2021 Update]
Our theory is that gold and silver had both risen a lot since the COVID panic run higher. So both were due a pullback and a rest. Just as they have done many times since this bull market in precious metals began in 1999-2000. The fear of higher interest rates has coincided with the end of this correction. And as we note above gold will likely head higher as investors realise inflation may be increasing too. Or perhaps central banks will intervene even further in the bond markets in an effort to control the yield?
Either way we’d say this is simply a correction in a larger move higher for gold. Below we’ll discuss a number of other indicators that point to a bottom being close in silver and especially in gold.
Where to From Here for Silver in NZD?
Silver has certainly taken the spotlight in recent weeks. The Reddit group WallStreetBets may not have been successful in their attempted short squeeze on silver but it did increase the interest in silver from late January.
For more on this see: Will The “Reddit Raiders” Cause Silver to Skyrocket?
But the New Zealand dollar silver price went sideways through most of February and then has been falling during March.
Here is a daily price chart of the action over the past 15 months.
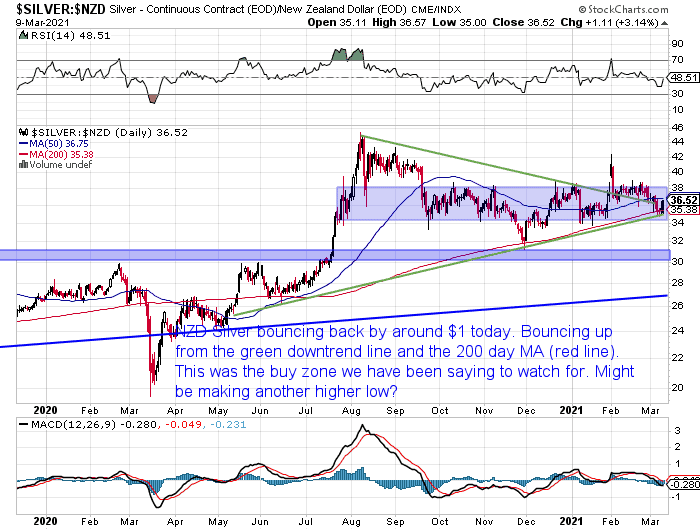
Silver bottomed out in late November, then dipped down to touch the 200 day moving average (MA) in January before the surge higher. It has now just touched the 200 day MA again. This also coincides with the rising green trendline.
Should You be Buying Silver With Your NZ Dollars Here?
The current set up in the chart above provides a low risk entry point where the odds are better than even that we see silver bounce from here. That would create another higher low in the current uptrend.
So the odds favour any current purchases of silver being pretty good in the long run.
Silver does remain somewhat hard to buy currently due to the bottlenecks in production from the huge surge in February. So there are limited choices and still delays of 2 weeks for the dispatch of 1kg silver bars.
The premiums on most silver coins still remain heightened as well.
Although we do have a subscriber only deal on Cayman Islands Marlin 1 oz Silver Coins where the premium above the spot price has hardly changed from before the surge in silver. Get in touch if you’d like to know about that.
So the best buys and probably those or 1kg silver bars.
How About the Yellow Metal? What’s Next for Gold in NZ Dollars?
As noted above silver has actually been in an uptrend since late November.
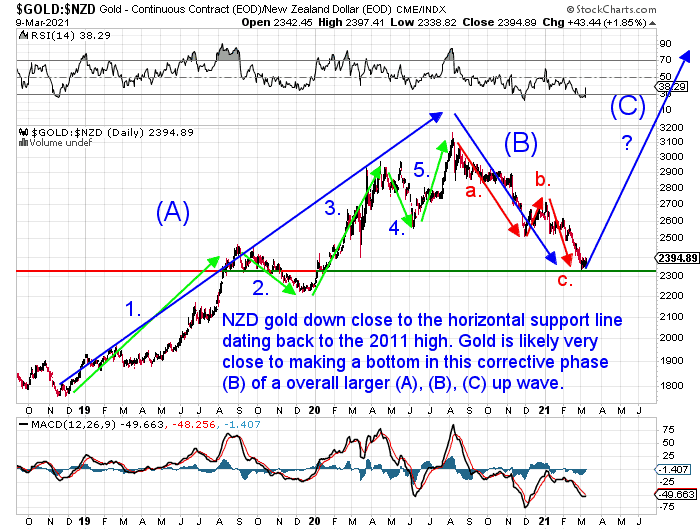
However we can’t say the same about gold in New Zealand dollars. As you can see in the daily chart below, gold has been in a correction since August last year.
Is that correction now coming to an end?

There are a number of other technical indicators pointing to that being the case…
Major Horizontal Support Line Holding
The first is the major horizontal support from the previous all time high in 2011 (the red/green line in the chart above). That is a line we have been watching out for. NZD gold dipped down close to there and may now be bouncing up off it.
Relative Strength Indicator (RSI)
The Relative Strength Indicator (RSI) is an overbought/oversold indicator. It got down well below 30 which indicates an oversold state.
Look back over many years in the chart above and you’ll see readings of below 30 on the RSI (top of the chart) are where bottoms are often made in the price.
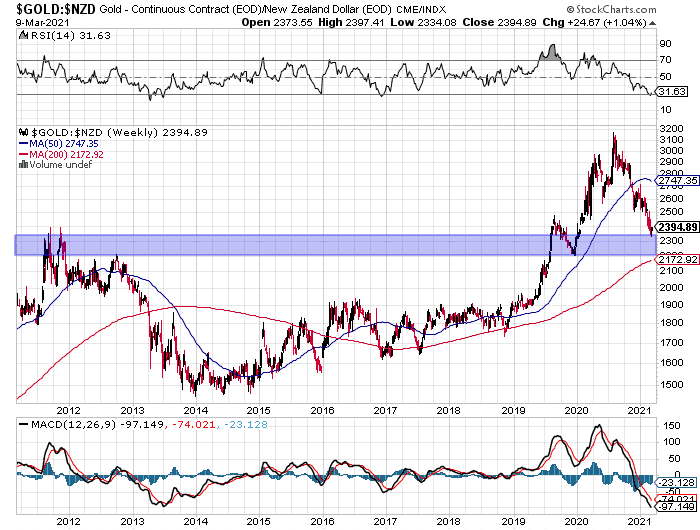
Weekly Chart Also Oversold and Touching Support Level
The weekly chart is also oversold on the RSI. It is also touching the major support area of the 2011 weekly highs too.
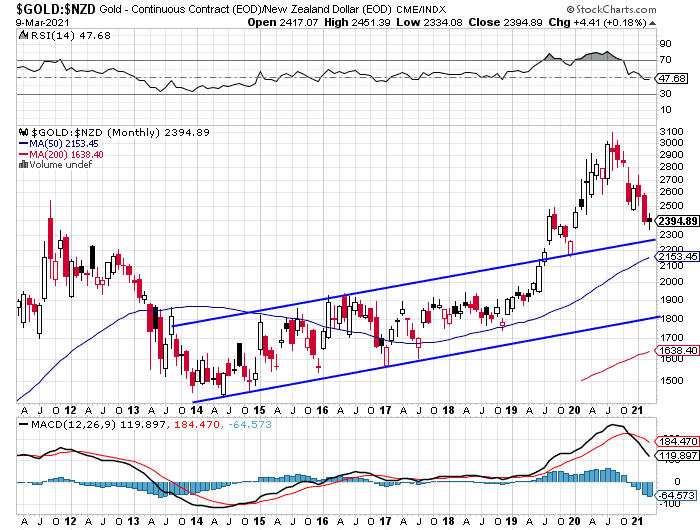
Monthly Chart
Below is a monthly chart. It plots the price at the end of every month. It is close to retesting this rising trend channel that it broke out of back in 2019. Odds favour it bouncing higher from there.
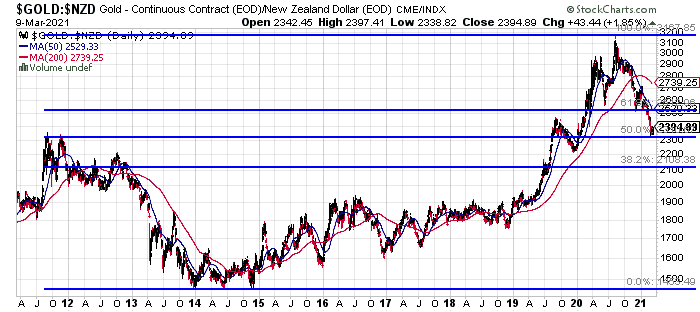
Fibonacci Retracement
After correcting from the high in 2011, NZD gold bottomed out way back in 2013-2014.
The chart below shows fibonacci retracement levels. These are produced from those 2013-2014 lows up to the all time high of last year. You can see that the 50% retracement level also happens to coincide with the 2011 highs mentioned above.
So that adds weight to the idea of a bottom forming here.
Elliott Wave Theory
We discussed Elliott wave theory and the NZD gold chart in our weekly update last week.
Marked on the chart below are..
“5 waves up (labelled 1-5) and 3 waves down (labelled a, b, c).
This is using Elliott Wave theory, which says in a bull move there are 3 major waves of a move up. An up phase, a down phase, and another up phase. These 3 waves are shown by the 3 blue arrows in the chart above.
In the first major up wave, we saw 5 smaller waves: Up, down, up, down, up. Then in the major wave down we have seen 3 minor waves: down, up, down. This is likely where we are now. If Elliott wave theory proves correct, then we will soon see the start of the third major wave up. This too would be made up of 5 minor up and down waves. This major wave up would take NZD gold much higher than the high from last year.
You may not place much weight on technical analysis. But at the end of the day markets involve millions and millions of people. People often act in herd behaviour. So patterns will take place and these patterns will repeat.
Of course there are no guarantees this Elliott Wave theory will play out. But for what it’s worth, we think the odds favour gold being very close to a bottom here.”
Need help understanding any of these technical analysis terms? Then check out: Gold and Silver Technical Analysis: The Ultimate Beginners Guide
Should You be Buying Gold in NZD Here?
All the above technical indicators are pointing to a likely bottom being put in for the NZD gold price.
So that makes anywhere around current levels being a very good entry point for gold.
Unlike silver there is no delay in the delivery of gold currently. So that is another positive with buying gold currently.
Final Positive (and Contrarian) Indicator For Buying Gold and Silver Now
There is final positive indicator for buying both gold and silver now. It is also a good contrarian indicator that we see from time to time, as sellers of gold and silver.
After the large surge in February, we have seen a much reduced interest in buying gold and silver over the last week or so. We have noticed this often happens around important bottoms. Unfortunately many people get their timing wrong and don’t buy when prices have been falling.
Of course none of these technical indicators above or this favourite contrarian indicator of ours are any guarantee. But they do up the odds that now is a decent time to buy.
If you are having trouble deciding between silver and gold then check this article out: Should I Buy Gold or Silver? 7 Factors to Consider in Gold vs Silver
Pingback: Australia in Trouble. How Will This Affect NZ? | Gold Prices | Gold Investing Guide
Pingback: Gold - a Leading Indicator for Bond Yields Topping Out? - Gold Survival Guide
Pingback: Better to Buy Gold by the Ounce or the Gram? - Gold Survival Guide