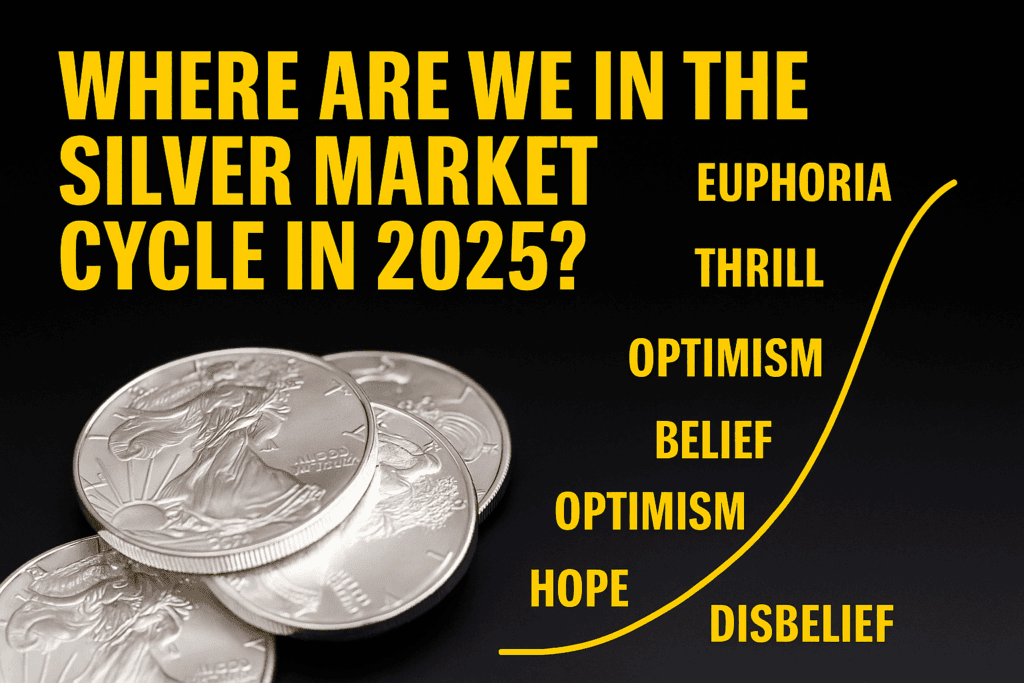
Silver has just surged to an all-time high of NZD $67 per ounce – a price we’ve never seen before. For New Zealand investors, this milestone feels exciting, and maybe even overdue, given silver’s role as both a safe-haven asset and a vital industrial metal.
But big moves like this always raise the same question: are we still early in the cycle, or are we closer to a peak?
Markets don’t move on fundamentals alone. Investor psychology – the emotions of disbelief, hope, optimism, greed, and fear – often drives prices as much as supply and demand. If you can spot where we are in the cycle, you can avoid panicking at the wrong time or chasing hype at the very top.
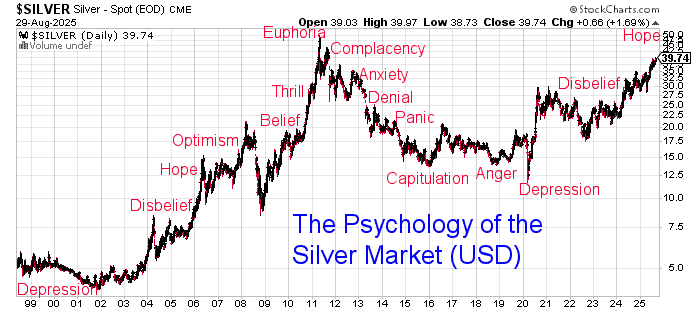
That’s why analysts often map silver against the psychology of market cycles. A well-known version is the “Wall Street Cheat Sheet” chart, which tracks emotions from despair to euphoria.
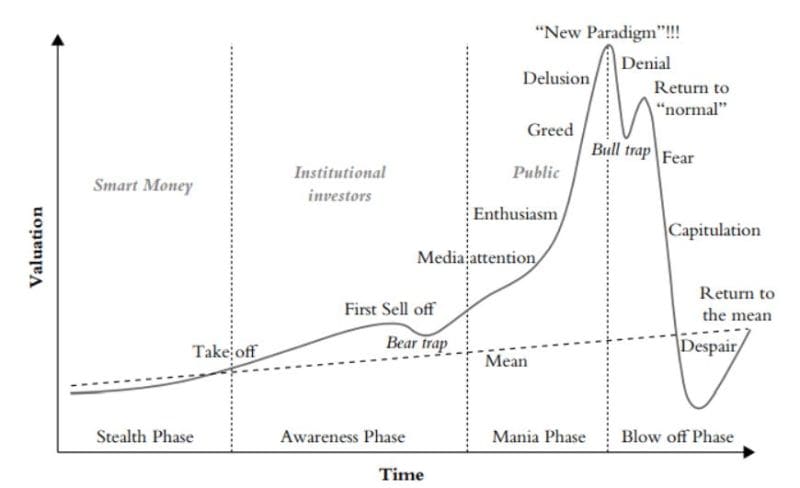
Recently, Austrian analyst Ronni Stoeferle shared his own take. He believes silver is only in the “early enthusiasm” stage of its long-term bull market – still far from the mania that usually ends a cycle.
So where are we right now? Let’s compare the classic psychology framework, our updated NZD silver chart, and Ronni’s view to see what the evidence tells us.
Table of Contents
Estimated reading time: 10 minutes
Silver Surges to NZD $67 – An All-Time High
On 1 September 2025, silver in New Zealand dollars hit $67.46 per ounce. That’s the highest price ever recorded here. For long-time holders, it’s been a rewarding climb after years of sideways trading.
Our updated NZD silver psychology chart (see below) shows how the emotions of past cycles line up with today’s market. The chart maps the last two decades of silver prices in NZD against the classic cycle of depression, disbelief, hope, optimism, euphoria, and despair.
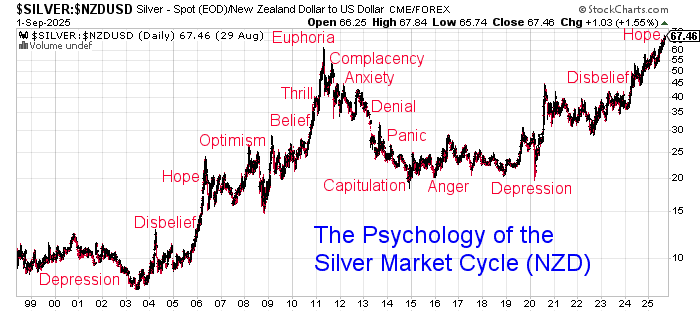
At first glance, this new high might make it look like we’re entering a late-stage “mania” phase. But there’s a puzzle. Despite the record price, global silver investment demand has slumped back to 2016 levels. In other words, investors worldwide are not yet rushing in.
This doesn’t fit the profile of a true mania, when retail buyers typically flood the market, premiums soar, and the media can’t stop talking about silver. Instead, what we see today is strength in price without the crowd piling in. That suggests silver may not be anywhere near euphoria yet.
The Classic Psychology Cycle of Markets
Markets rise and fall in patterns that repeat again and again. The famous “Wall Street Cheat Sheet” chart shows how emotions drive these cycles. Prices don’t move in a straight line. They climb with hope and optimism, peak with thrill and euphoria, then fall back through anxiety, denial, panic, and despair.
This emotional cycle is not unique to silver. It shows up in stocks, real estate, and even cryptocurrencies. But silver investors know it all too well. Past runs in silver — like the spikes in 1980 and 2011 — followed this very pattern.
Here’s the Cheat Sheet version of the cycle:
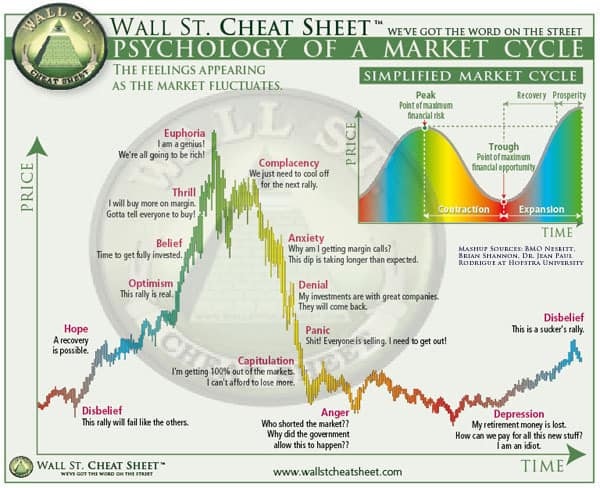
The key lesson is simple: when the crowd feels most confident, risk is highest. And when despair sets in, opportunity is greatest.
(Related:Gold and Silver Technical Analysis: The Ultimate Beginners Guide >>)
Comparing Three Views of the Silver Cycle
So where does silver sit today? To answer that, it helps to compare three different cycle maps:
- Our NZD Silver Cycle Chart
- Silver in NZD just hit a record $67 per ounce.
- At face value, this looks like an “optimism” or even “belief” stage.
- Yet global silver investment demand is still down at 2016 levels. That’s not the behavior of a mania.
- Silver in NZD just hit a record $67 per ounce.
- The Wall Street Cheat Sheet
- In this model, silver appears to be moving out of “Disbelief” and into “Hope → Optimism.”
- Investors are starting to accept that the rally may be real, but we’re nowhere near “thrill” or “euphoria.”
- In this model, silver appears to be moving out of “Disbelief” and into “Hope → Optimism.”
- Ronni Stoeferle’s Cycle
- Ronni places silver “between media attention and early enthusiasm.”
- His model focuses more on investor participation than raw emotion.
- This lines up closely with the Cheat Sheet’s “Hope → Optimism.”
- Ronni places silver “between media attention and early enthusiasm.”
Where They Align — and Differ
- All three charts agree: silver is not yet in the mania stage.
- Cheat Sheet frames it as emotions of “Hope/Optimism.”
- Ronni frames it as “Media Attention/Early Enthusiasm.”
- Our NZD chart shows prices that look hot in local terms, but weak global demand proves the crowd has not arrived yet.
One difference worth noting is that Ronni’s cycle view covered gold, silver, and mining shares together, while here we’ve focused on silver alone. In practice, though, this distinction may not matter much. Gold has far greater profile in mainstream media, while mining shares have almost none. Those two extremes may balance each other out, leaving the combined cycle in a similar place to where silver itself appears to be: still early, and far from mania.
Put simply: silver has likely moved past disbelief, but it’s still early in the bull cycle. The public is not euphoric. Media headlines are not yet screaming “Silver to the Moon.” That tells us the biggest emotional stages — thrill, euphoria, greed — still lie ahead.
(For more on the topic of precious metals cycles see: Gold Cycles vs Property Cycles: When Will Gold Reach Peak Valuation?)
The USD Perspective – Room to Run
While NZD silver has broken into record territory, the global picture tells a different story. In U.S. dollars, silver is still well below its 2011 peak of around USD $49 per ounce. Even after the strong run in 2025, USD silver trades closer to $39–40.
Most of the world watches silver in U.S. dollars, so until it clears the 2011 peak, many investors won’t see this move as historic.
This gap between NZD and USD charts is another clue that silver is not yet in a mania stage. Local investors might feel the heat, but globally, silver has plenty of room to run before it even tests old highs.
When USD silver eventually breaks above its 2011 peak, that’s when psychology could flip. What looks like “hope” or “optimism” today, could quickly turn into “belief” and “thrill” as the wider investing public wakes up.
The 45-Year Cup and Handle Setup
If we zoom out beyond the daily headlines, silver’s long-term chart paints a powerful picture. Over the past 45 years, silver has formed what technical analysts call a “cup and handle” pattern. This is one of the most reliable bullish setups in charting.
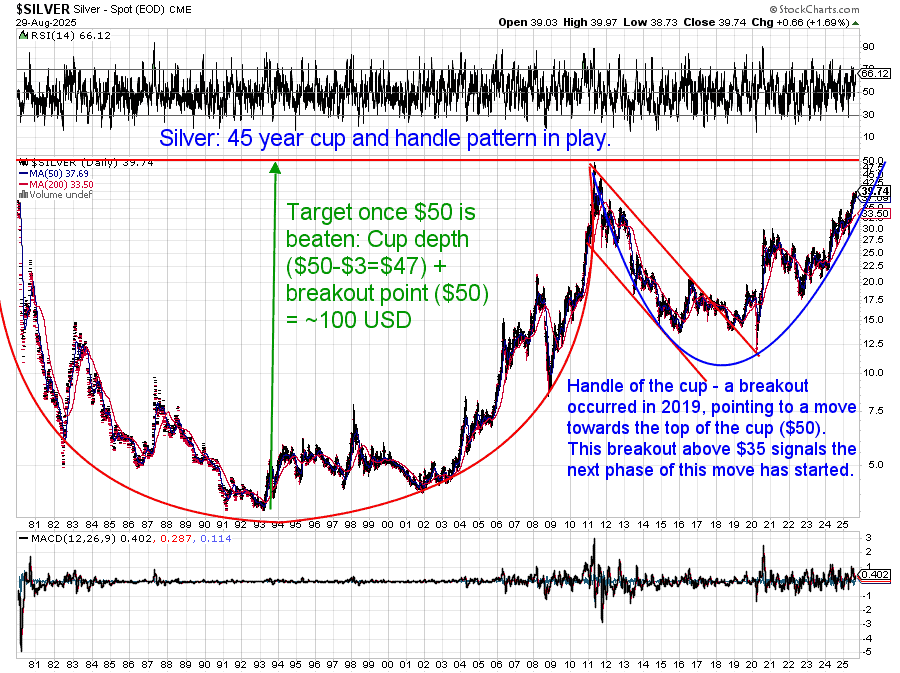
- The cup is the wide, rounded base that stretches from the 1980 peak through the long bear market and the rebound to 2011.
- The handle is the consolidation that followed – more than a decade of sideways trading between 2011 and 2023.
- Now, in 2025, silver appears to be breaking out of that handle.
Why does this matter? Cup and handle patterns often precede major price surges. The breakout target is usually measured from the depth of the cup. In silver’s case, that points to a potential move toward USD $70–75 per ounce over the next leg of the cycle. That’s well above the 2011 high of $49, and would mark a new all-time record in U.S. dollar terms.
This long-term view lines up with what Ronni Stoeferle has argued: the secular bull market in precious metals is still in its early to middle innings. If the pattern holds, silver’s run may be far from over.
Where Is Silver Really in the Cycle Today?
Looking at all the evidence, silver seems to be in the early stages of a new bull market rather than at the end of one.
- In NZD terms, silver has broken into record highs at $67. That feels exciting and even “optimistic.”
- In USD terms, silver is still well below its 2011 peak. The world hasn’t seen the breakout yet.
- The Wall Street Cheat Sheet points to silver moving from Disbelief into Hope/Optimism.
- Ronni Stoeferle’s cycle places it between Media Attention and Early Enthusiasm.
- And importantly, global investment demand has fallen back to 2016 levels. That’s the opposite of what we’d expect in a mania phase, when crowds rush in and demand soars.
Put simply: we may feel silver heating up in New Zealand, but globally the market is still in the hope/early enthusiasm stage. The thrill, euphoria, and mania that end cycles are still to come.
This mismatch — record highs locally, apathy globally — could be a gift for long-term investors. It means there’s still time to accumulate before the wider public wakes up and pushes silver into the later, more emotional phases of the cycle.
What This Means for Investors
The silver cycle teaches us an important lesson: price alone does not tell the full story. At NZD $67, silver may feel “expensive.” But when you look at the psychology, the USD chart, and weak global demand, it’s clear we are far from the mania stage.
For investors, this points to three simple takeaways:
- Don’t be fooled by local highs
– Yes, silver is at records in NZD. But globally, the big breakout is still ahead. Mania arrives when the USD chart breaks new ground and the media can’t stop talking about silver. - The crowd is not here yet
– Global investment demand is still quiet. That means the mainstream hasn’t joined the party. History shows the best returns often come before the herd piles in. - Plan before the mania
– Once silver reaches thrill and euphoria, premiums rise, shortages appear, and risk grows. Now is the time to buy steadily and store securely — before excitement turns to frenzy.
At Gold Survival Guide, we believe in education first. Understanding where silver sits in the cycle helps you make informed decisions, not emotional ones. That’s how you protect your wealth and your peace of mind through both the highs and the lows.
There are plenty of options in silver currently but you can see what silver coins are available here. Or for the best value silver check out the silver bars here.
Or for more help in deciding when to buy silver (or gold) see: When to Buy Gold or Silver: The Ultimate Guide >>
Editors Note: This article was first published on 12 December 2017. Fully updated 1 September 2025 including Ronni Stoerferle’s chart and the cup and handle pattern.
Pingback: Latest on the COMEX Silver CoT Report - Gold Survival Guide
Pingback: Why Will Gold Still be Valuable in the Future? - Gold Survival Guide
Pingback: RBNZ Currency Printing Continues on Schedule - Gold Survival Guide
Pingback: Is This Corrective Wave Down in NZD Gold About to End? - Gold Survival Guide
Pingback: Should We be Calling For an Inquiry into the RBNZ’s Response to Covid? - Gold Survival Guide
Pingback: USD Silver Breaks Above Key $30 Mark - 12 Year High - Gold Survival Guide