Prices and Charts
NZD Gold Pulling Back as Expected
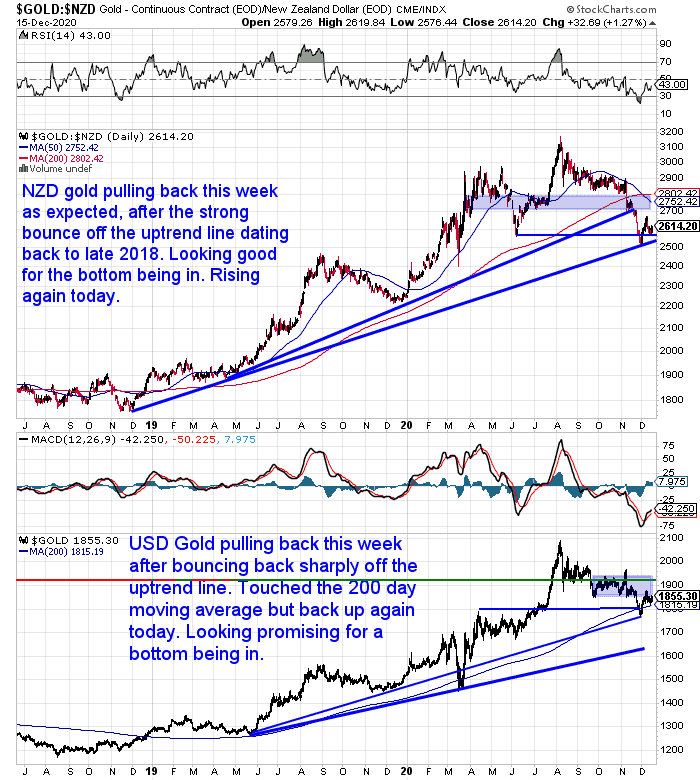
Last week we said gold in New Zealand dollars was due a pullback in the short term after such a strong bounce. That proved to be the case this week with NZD gold dipping under $2600.
But today it has bounced back and is again above $2600. We could still see a move down to retest the rising uptrend line.
However to us it is still looking promising for a bottom being now in.
NZD Silver Also Down But Up
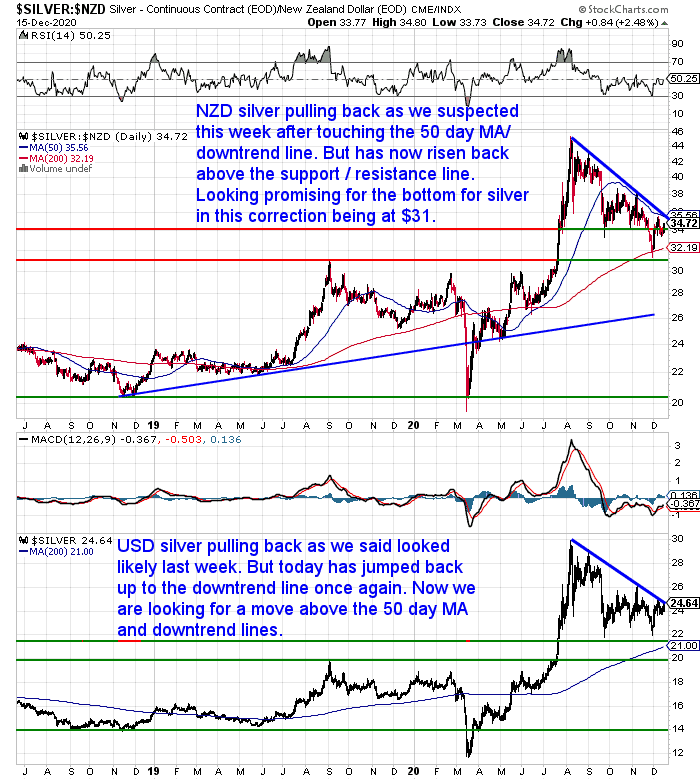
Silver in New Zealand dollars was also down for the week but up today. Once again back above the horizontal support/resistance line. Silver is also looking promising for the bottom being in at $31. We could still see it move down to retest the 200 day moving average (MA) line though.
Then we are looking for silver to get back above the 50 day MA which also coincides with the blue downtrend line. But we may have to wait until the New year to see that.
This week’s feature article takes a detailed look at why right now is looking like an excellent buy zone for silver. Not just looking at the charts, but also taking into account a couple of contrarian indicators that we have found to be good indicators of a bottom in the past.
NZ Dollar Still Holding Up
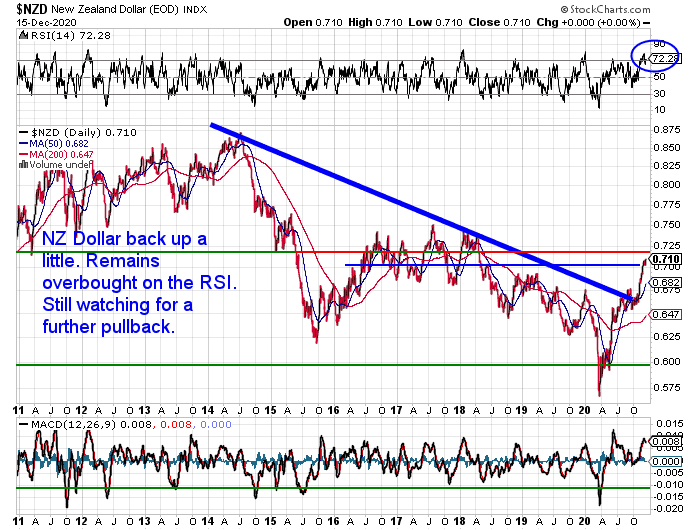
Despite remaining very overbought on the Relative Strength Index (RSI), the Kiwi dollar is holding up well in the 0.70’s.
However we are still looking for a further pullback to come before too long. If you look at previous occasions when the RSI was this overbought above 70, each time there has been a pretty hefty pullback. That would of course give a boost to local gold and silver prices.
Need Help Understanding the Charts?
Check out this post if any of the terms we use when discussing the gold, silver and NZ Dollar charts are unknown to you:
Continues below
—– OFFER FROM OUR SISTER COMPANY: Emergency Food NZ —–
NEW: Certified Organic Long Life Emergency Food
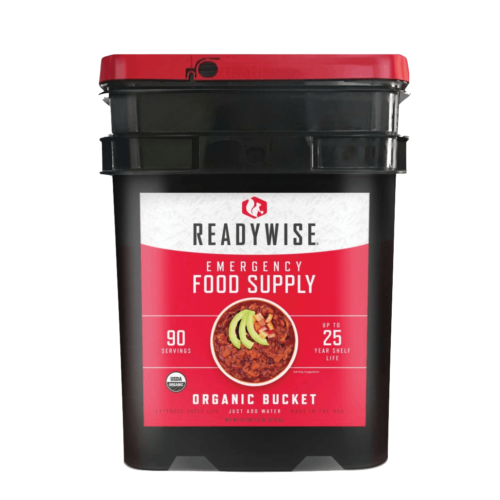
This easy to carry bucket has 90 servings of organic breakfasts and mains
Free Shipping NZ Wide
Get Peace of Mind For Your Family NOW….
—–
An Excellent N.Z. Silver Buy Zone is Here – Charts Update Dec 2020
After rising sharply from March to August, silver has fallen sharply in the last few months. As a result, we now have what looks like an excellent silver buy zone. In this week’s feature article we look at a few silver charts showing why this might be. Plus we also have a couple of contrarian indicators that in the past have been useful in determining when a bottom may be in…

Your Questions Wanted
Remember, if you’ve got a specific question, be sure to send it in to be in the running for a 1oz silver coin.
More People Taking Note of the Divergence of Gold from Real Interest Rates
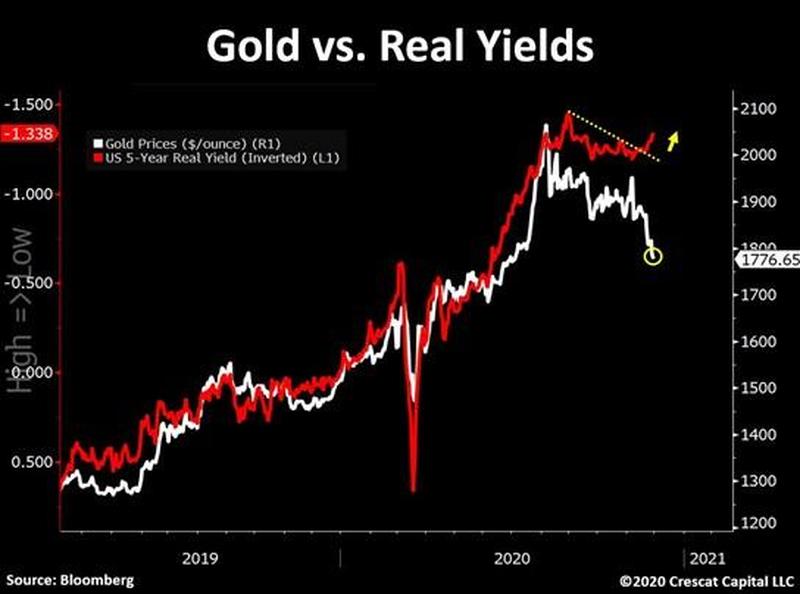
Last week we covered how gold has been falling even while real interest rates (that is after inflation interest rates) have been falling.
See: Do Gold and Real Rates Moving in Tandem Signal a Big Move for Gold?
Usually as real rates fall gold rises and vice versa. Lower returns from bonds mean people move into gold.
More people have been taking notice of this. A post in Zerohedge pointed out this week:
“Real yields, perhaps one of the most reliable macro drivers for gold, are now suggesting a key turn back up in the metal. Even though US 10-year interest rates have been rising since August, inflation expectations have begun to outpace nominal yields once again. Consequently, real yields are turning even more negative. As shown inverted in the chart below, declining real yields tend to drive gold prices upward. These two lines are now diverging significantly and, in our opinion, strongly suggest that the bull market for gold is poised to resume.
Source.
This is adding weight to our notion that gold (and silver, as pointed out in this week’s feature post) have likely bottomed.
As we said in that article, the fact that hardly anyone is buying currently is a good contrarian indicator that the bottom is in for silver and gold.
While vaccines might to some mean that the worst of this crisis is behind us, even more negative real interest rates mean your savings will need protection long after the COVID panic has subsided.
History Says: Great Time of the Year to Buy Gold and Silver
In case you missed our recent article: When to Buy Gold or Silver: The Ultimate Guide, here’s an excerpt that is very relevant at this time of the year…
Why Buying This Year is Better Than Waiting Until Next Year
The chart of gold in NZ Dollars below, shows that you’ll also want to buy this year and not wait for next year.
As in 9 of the last 10 years buying towards the end of one year saw the gold price higher at the end of the following year (see the green arrows).
Note: We can also likely add this year to those 9 years where gold finishes the year higher than it ended the last year. That is assuming gold doesn’t tumble all the way back down below $2300 before the end of December – not very likely we’d say.
Also keep an eye out for sharp drops in the price of gold and silver over the low volume Christmas and New Year holidays. In 8 of the last 11 years we have seen the gold price fall sharply around this time (see the green ellipses). Therefore also making it a good time to buy gold and silver near the end of the calendar year. Will 2020 prove to be the same?
Read more.
Refer back to the top of this email for holiday ordering restrictions. We’re not closed as such but it depends upon suppliers as to what is available when. So get in touch over the break if you see a dip and are interested in buying.
- Email: orders@goldsurvivalguide.co.nz
- Phone: 0800 888 GOLD ( 0800 888 465 ) (or +64 9 2813898)
- or Shop Online with indicative pricing
— Prepared for the unexpected? —
Here’s how to always have clean fresh drinking water on hand.
The Sport Berkey Water Filter Bottle – $69 Delivered
Ideal for travel. Driving, camping, backpacking.
Free Shipping NZ Wide.

—–
|
Pingback: 2021: Many Hoping for a Better Year - But Still Many Uncertainties - Gold Survival Guide